Person‐Centered Analysis
Media
Part of Person‐Centered Analysis
- Title
- Person‐Centered Analysis
- extracted text
-
Person-Centered Analysis
ALEXANDER VON EYE and WOLFGANG WIEDERMANN
Abstract
The majority of data analyses in the empirical sciences that are concerned with
humans proceeds at the level of variables. Typical results relate variables to each
other, for example, in correlational or regression-type statements. In these analyses,
individuals are considered random data carriers, replaceable without damage by
other individuals, also random data carriers. This type of research is known as
variable-oriented. It has been shown that statements at the aggregate level, that is,
variable-oriented statements, are rarely applicable to the individual case. In contrast,
person-oriented research, also known as person-centered research, proposes focusing
on the individual. Analyses in person-oriented research differ from procedures
that are customary in variable-oriented research. In person-oriented research,
parameters are estimated first at the level of the individual. If generalization is
the goal of analysis, aggregation takes place at the level of parameters instead of
raw data. Implications of this strategy are major. Data need to be collected in a
way different than in variable-oriented research, data analysis is different, and
the resulting statements are different as well. This article introduces readers to
person-oriented research and gives two examples of person-oriented data analysis,
that is, configural frequency analysis and item response modeling.
INTRODUCTION
Most empirical researchers pursue the goal of making general statements.
These are statements that are valid for populations, not just individuals. In
the pursuit of this goal, strategies of data collection have been developed,
strategies of data analysis and inference statistics have been established, and
statements that describe results are formulated such that they sound general
in the sense that they do not include terms that refer to individuals any more.
Instead, these statements, known as aggregate-level statements, contain terms
that refer to variables and their interrelations and are based on information
that is the result of aggregation at the level of raw data.
Unfortunately, and as is well known, aggregate-level results rarely describe
individuals validly, if ever. The average individual may not exist. Walls and
Schafer (2006) note that “ … the average may be highly atypical” (p. 14). This
Emerging Trends in the Social and Behavioral Sciences. Edited by Robert Scott and Stephen Kosslyn.
© 2015 John Wiley & Sons, Inc. ISBN 978-1-118-90077-2.
1
2
EMERGING TRENDS IN THE SOCIAL AND BEHAVIORAL SCIENCES
applies in particular when averages or, in general, population parameters are
estimated based on aggregated raw data. Aggregation carries the risk of distorting relations. In methodological articles, this has been discussed at least
since Estes (1956), who addressed issues concerning inference from curves
based on group data. Recent work by, for example, Molenaar and Campbell
(2009) or Salway and Wakefield (2005; cf. Wakefield & Salway, 2001) has presented statistical frameworks that allow researchers to determine whether
a given data set can meaningfully be aggregated at the level of raw data.
For examples of problems that can arise when aggregation is performed, see
Schmitz (2000) or von Eye and Bergman (2003). These examples show that in
variable-oriented analysis, (i) descriptions of processes of growth and development as well as relations among variables can be completely invalid, and
(ii) not a single case may be described validly.
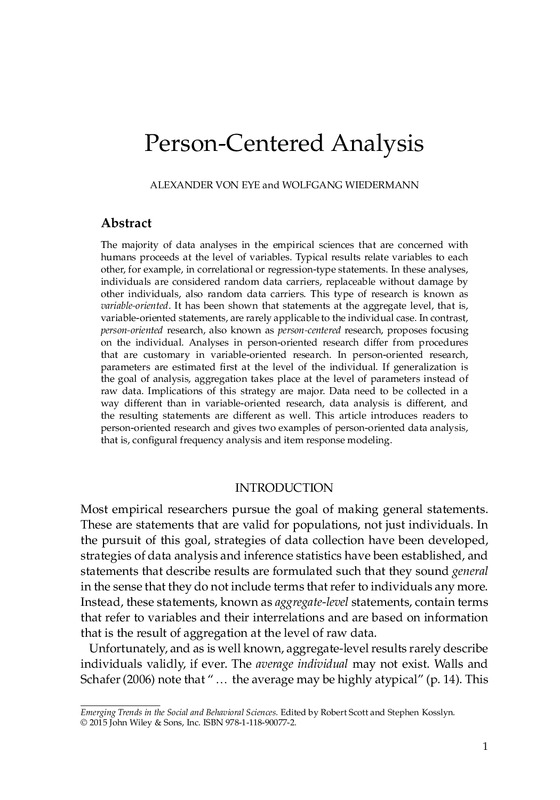
To illustrate the possible distortion in conclusions from aggregated data,
we recalculate an artificial data example from von Eye, Bergman, and Hsieh
(in press). The data describe the adolescent growth spurt. The height of six
adolescents (C1 through C6) is measured nine times each. The adolescents
differ only in the timing of their growth spurts. The growth spurt itself is
the same for every individual, in particular in steepness and duration (see
Figure 1). The beginning and the end of the growth spurts shift by one observation point from C1 to C2 to C3, … , to C6. Growth, however, is equally
steep, and the duration of each spurt is the time interval between two observation points. Now, let, in an aggregation step, averaging and then estimating
the growth curve be performed. This step results in the averaged trajectory,
which is not nearly as steep as any of the individual trajectories, and suggests
that the growth spurt takes much longer. The resulting trajectory is depicted
in the curve for the average, in the last panel. This curve fails to describe any
of the individuals correctly.
In the remainder of this article, we first present the main tenets of
person-oriented research (Bergman & Magnusson, 1997; von Eye &
Bergman, 2003). We then discuss implications for design and data analysis.
Two examples of person-oriented data analyses (i.e., Configural Frequency
Analysis and Item Response Modeling) are illustrated using empirical data.
THE TENETS OF PERSON-ORIENTED RESEARCH
In 1997, Bergman and Magnusson presented the following tenets of
person-oriented research.1
1. The following paragraphs, about the tenets of person-oriented research, borrow heavily from von
Eye and Bergman (2003).
7
6
6
6
5
5
5
4
4
4
3
3
2
2
1
1
1
0
0 1 2 3 4 5 6 7 8 9 10
Time
0
0 1 2 3 4 5 6 7 8 9 10
Time
7
7
6
6
6
5
5
5
4
4
4
C6
7
3
3
2
2
1
1
1
0 1 2 3 4 5 6 7 8 9 10
Time
0
0 1 2 3 4 5 6 7 8 9 10
Time
0 1 2 3 4 5 6 7 8 9 10
Time
3
2
0
3
3
2
0
C4
C3
7
C2
7
C5
C1
Person-Centered Analysis
0
0 1 2 3 4 5 6 7 8 9 10
Time
7
6
Average
5
4
3
2
1
0
0 1 2 3 4 5 6 7 8 9 10
Time
Figure 1 Growth spurts in six adolescents (artificial data).
Functioning, process, and development of behavior are, at least in part,
specific to the individual.
Because of its complexity, the study of functioning and development necessitates taking many factors and their interrelations into
consideration.
There is lawfulness and structure both in intraindividual constancy and
change in functioning and development as well as in interindividual
differences in functioning and development.
Processes occur in a structured way and can be described in terms of
patterns of the involved factors; the meaning of the involved factors is
4
EMERGING TRENDS IN THE SOCIAL AND BEHAVIORAL SCIENCES
determined by the factors’ interactions with other factors; development
can be described as constancy and change in these patterns.
The number of differences between patterns is, in theory, infinite; the number of observed differences, however, will be small and finite.
Some patterns occur more frequently than other patterns, or more frequently than expected based on prior knowledge, assumptions, and
estimates. These patterns can be termed common types. Accordingly,
there will also be patterns that occur less often than other patterns
or less often than expected. These patterns can be termed common
antitypes.
For quantitative comparisons of individuals on the same scale and over
time, dimensional identity is required; for qualitative comparisons of individuals, dimensional identity is not required.
The first six tenets have been discussed extensively in the literature (e.g.,
Bergman, von Eye, & Magnusson, 2006; Sterba & Bauer, 2010). The seventh
tenet (dimensional identity) was added by von Eye and Bergman (2003). This
tenet states that scale values can be used for comparison of individuals only
if the scale and its items have the exact same characteristics in the individuals (or groups) to be compared. This is by no means a given, not even for
well-established scales. For example, Lambert et al. (2003) showed that the
widely used Child Behavior Check list (CBCL; Achenbach & Edelbrock, 1981)
has a different than the published dimensional structure in populations of
African-American youth and in Jamaican youth. Therefore, the same scale
value on the CBCL can have different meaning when it is observed for youths
from these three populations.
In the following sections, we review the conditions that must be fulfilled for
statements to be valid and for instruments to allow comparative statements.
Later, we discuss methods of data analysis with respect to these conditions.
SAMPLING FOR PERSON-ORIENTED RESEARCH
In person-oriented research, researchers proceed from the assumption that
multiple populations may exist (von Eye & Bogat, 2006). When these populations are known before data collection, samples are drawn from these
populations, and the sizes of these samples can be determined using standard methods of power analysis. In other cases, however, neither the number
nor the size of populations is known. These populations typically overlap, as
in the case of height distributions of men and women or visual acuity of older
and younger populations. Methods of grouping, such as finite mixture distribution decomposition, latent class analysis, or cluster analysis, are often
Person-Centered Analysis
5
used to separate these populations. It is important to realize that when multiple populations are assumed to be represented in a data set, aggregation of
raw data can result in misrepresentations such as those known from the ecological fallacy. This fallacy describes the error that is committed when results
that were created at the aggregate level are applied to individuals. Thus, the
populations in person-oriented research have to be identified and analyzed
separately.
There are at least three changes in the routines of sampling and data
analysis that result from this procedure. First, the data collector has to
make sure that each of the possible (sub)populations is large enough for
the intended methods of analysis to be applicable. This is a rough task,
considering that both number and relative size of these populations may
be unknown. Total sample sizes must, therefore, be much larger than in
standard empirical research.
Second, dimensional identity must be established to enable researchers to
make comparative statements. Differential item functioning (DIF), that is,
the population-specific performance of items (discussed in the section titled
“Item Response Theory”), can be used as the basis for separation of populations. One issue with DIF is that it represents a main reason for lack of
dimensional identity and, thus, a main reason for lack of comparability of
individuals from different populations.
Third, and this applies in particular to developmental research, the number
of data points must be large enough that parameters can be estimated reliably
and validly for the individual. This again is a daunting task because items,
questionnaires, and tests can change their characteristics over the course of
long series of administrations. If change occurs, dimensional identity can be
in jeopardy even at the level of the individual.
As far as data analysis is concerned, researchers often create two sets of
variables. The first is used to establish the existence of groupings and subpopulations. Examples include groupings that are created based on DIF. The
second group of variables is used to compare the thus established groupings
of individuals. This comparison answers the question whether the groupings that are based on one set of variables are also meaningful in the space
of different variables. If the answer to this question is yes, the grouping can
be externally valid. These two sets of variables must not overlap. If the same
variables are used to establish a grouping and to separate the groups, severe
bias is bound to result.
An example in which groupings were created based on one set of variables
that were then validated in the space of other variables can be seen in the
work by Tubman, Vicary, von Eye, and Lerner (1990). First, the authors classified adolescents based on patterns of longitudinal substance abuse. Then,
they asked whether adjustment in adulthood varies with pattern of substance
6
EMERGING TRENDS IN THE SOCIAL AND BEHAVIORAL SCIENCES
abuse. Results suggest that adjustment problems and psychiatric problems
are far more likely when an adolescent uses leisure drugs and hard drugs
longitudinally.
In the following two sections, we discuss two statistical methods that are
particularly useful in person-oriented data analysis, Configural Frequency
Analysis (CFA) and Item Response Theory (IRT). We begin with CFA.
Configural Frequency Analysis. Bergman et al. (2006) labeled CFA (Lienert &
Krauth, 1975; von Eye & Gutiérrez-Peña, 2004; von Eye, Mair, & Mun, 2010) as
most suitable for person-oriented research. Using CFA, researchers analyze
patterns of categories of variables. These patterns, also called profiles or configurations, result from crossing categorical variables. To keep the number of
configurations manageable, continuous variables are often categorized, even
dichotomized.
For each configuration, it is asked whether the number of cases that exhibit
this profile differs from the expected number. When, for a configuration,
more cases were observed than expected, this configuration is said to constitute a CFA type. When fewer cases are observed, this configuration is said
to constitute a CFA antitype. If the observed number does not deviate from
the expected, this configuration constitutes neither a type nor an antitype.
The expected number of cases for a configuration is estimated based on a
CFA base model, a probabilistic chance model. It takes all effects into account
that are NOT of interest to the researcher. If the model is rejected, at least
one of the effects that are of interest must exist. Types and antitypes indicate
where in the cross-classification the effects manifest in the form of local associations (Havránek & Lienert, 1984; Hand & Vinciotti, 2003). Most CFA base
models can be estimated using statistical models for frequency data.
To give an example of a CFA base model, consider prediction CFA (P-CFA;
Heilmann, Lienert, & Maly, 1979; von Eye et al., 2010). The base model for
P-CFA takes into account
•
•
•
the main effects of all variables;
all possible interactions among the predictor variables; and
all possible effects among the criterion variables.
If this model is rejected, types and antitypes, by necessity, reflect
predictor–criterion relations, because these are exactly the effects that
the base model did not include. Types and antitypes in P-CFA cannot reflect
relations among predictors or relations among criterion variables because
these relations are part of the base model.
Naturally, different base models can result in different types and antitypes
(Mellenbergh, 1996). If, for example, the distinction between predictor and
Person-Centered Analysis
7
criterion variables in the P-CFA example is not made, the four variables can
be analyzed under the base model of first-order CFA. This base model, also
known as the model of variable independence, takes only the main effects of
each variable into account. Types and antitypes can, under this base model,
result from any interaction. If any interaction that is not included in P-CFA
exists, the pattern of types and antitypes from first-order CFA can be expected
to differ from the pattern of types and antitypes from P-CFA, for the same
cross-classification.
Data Example
For the following example of CFA application, we recalculate the data
published by Stemmler, Lösel, Beelmann, Jaursch, and Zenkert (2005). In a
study on child problem behavior in kindergarten and elementary school,
the authors used gender (G; 1 = male, 2 = female), externalizing problems
(E), and internalizing problems (I) as predictors of classroom behavior
problems (C; E, I, and C coded as 1 = below the 75th percentile, 2 = above the
75th percentile). The authors analyzed the cross-classification of these four
variables with P-CFA. Results suggest that one prediction antitype and two
prediction types exist. The antitype suggests that fewer girls than expected
under the base model of P-CFA can be predicted to exhibit intense classroom
problems if they had low scores on both the externalizing and internalizing
scales in kindergarten.
The first type suggests that more boys than expected under the P-CFA base
model can be predicted to exhibit serious classroom problems if they exhibited externalizing problems but no internalizing problems in kindergarten.
The second type suggests that more boys than expected can be predicted
to exhibit serious classroom behavior problems in elementary school if they
scored high on both the externalizing and the internalizing scales in kindergarten. For more detail, see Table 3 in Stemmler et al. (2005).
For the reanalysis of these data, we change the research question. We ask
whether those children who score high versus low in classroom problems
differ in particular profiles on G, E, and I. The base model for this question
is specified such that it can be rejected only if classroom behavior problems
are related to one or more of the three discriminator variables. The model
includes all possible relations among discriminator variables. Therefore, it
cannot be rejected because the discriminator variables may be related to each
other. These relations are taken into account.
Using the expected cell frequencies from this base model, we compare
all patterns of high versus low in classroom problems with each other. We
use the normal approximation of the binomial test and protect ? by using
the Holland–Copenhaver procedure (von Eye, 2002). The results of this
two-group CFA appear in Table 1.
8
EMERGING TRENDS IN THE SOCIAL AND BEHAVIORAL SCIENCES
Table 1
Two-group CFA with the discriminator variables gender (G),
externalizing problems (E), and internalizing problems (I) in
kindergarten, and the grouping variable classroom problems (C) in
elementary school
Configuration
GEIC
1111
1112
1121
1122
1211
1212
1221
1222
2111
2112
2121
2122
2211
2212
2221
2222
m
98.00
21.00
138.00
10.00
29.00
8.00
39.00
3.00
31.00
14.00
18.00
6.00
12.00
8.00
10.00
2.00
Statistic
p
−.533
.296882
3.784
.000077
−.953
.170361
Type?
Discrimination Type
1.660
−2.887
.001944
−1.218
.111560
−2.974
.001470
−.053
.478696
Discrimination Type
Discrimination Type
Table 1 suggests that three discrimination types exist. The first is constituted
by configuration 1 1 2., where the dot indicates that the students with high
scores in classroom problems are compared with the students with low scores
in classroom problems. This discrimination type shows that of those male
students who exhibit low scores in externalizing but high scores in internalizing in kindergarten, far more will also show low levels of classroom problems
in elementary school than severe classroom problems. The second discrimination type is constituted by configuration 2 1 1.; this type shows that of those
female students who exhibit low scores in both externalizing and internalizing in kindergarten, far more will also show low levels of classroom problems
in elementary school than severe classroom problems. The third discrimination type is constituted by configuration 2 2 1.; this type shows that of the girls
with high levels of externalizing problems in kindergarten but low scores of
internalizing problems, relatively higher numbers will show high, not low
levels of classroom problems in elementary school.
This example can be used to highlight characteristics of CFA solutions. In
particular,
Person-Centered Analysis
9
In Table 1, the largest difference between two cell frequencies does constitute a discrimination type. This is not always the case. The main reason
for this characteristic of CFA results is that CFA focuses on discrepancies
from expectation instead of sheer size. Therefore, even relatively small differences between observed and expected frequencies can be larger than
expected, and relatively large differences can be as expected.
CFA tables are interpreted only after the base model is rejected. It is
important to note that rejection of a base model does not guarantee
that types and antitypes exist. However, when a base model describes
the data well, there will be no large discrepancies between observed
and expected data, and the search for types and antitypes becomes
pointless.
Only a selection of cells (configurations) emerges as type or antitype (or
as discrimination type). The remaining cells do not indicate significant
deviations from the base model.
From the perspective of person-oriented research, it is important to realize
that CFA results are expressed in terms of profiles that describe individuals or groups of individuals instead of relations among variables.
To compare with results from CFA, we also estimated log-linear models.
One model that describes the data well includes all main effects and the
interactions between (i) externalizing and classroom behavior problems
and (ii) gender and classroom behavior problems. This result certainly is
plausible and interpretable, but one clearly needs CFA to identify those
sectors of the data space that represent the local associations among the
variables that span the cross-classification in Table 1. We conclude that
variable- and person-oriented strategies of data analysis can be used in a
complementary way.
In the next section, we describe the characteristics of IRT models with
respect to person-oriented research.
Item Response Theory. The comparison of individuals on the same scale
requires dimensional identity of the scale, that is, the items of a scale must
have the same characteristics across individuals (or groups). IRT, as an
umbrella term for a broader family of logistic models, seems well suited to
meet this prerequisite. The following section introduces the basic logistic
model and discusses its properties with a special focus on person-oriented
research (see also von Eye et al., in press). A data example is given analyzing
alcohol consumption patterns among university students.
The basic one-parameter logistic model, known as the Rasch model (Fischer & Molenaar, 1995; Koller, Alexandrowicz, & Hatzinger, 2012; Rasch,
10
EMERGING TRENDS IN THE SOCIAL AND BEHAVIORAL SCIENCES
1960), can be used to convert binary outcome variables2 (e.g., 0 = item
not endorsed/incorrect answer, 1 = item endorsed/correct answer) into
quantitative estimates of item difficulties and individual performances in
terms of the same equal-interval units. Let xvi be the observed response of
the random variable Xvi of person v answering item i. The Rasch model
states that the probability of xvi can be expressed as
P(Xvi = xvi |?v , ?i ) =
exp[xvi (?v − ?i )]
,
1 + exp(?v − ?i )
where ? v represents the (latent) ability of person v and ? i represents the
(latent) difficulty of item i. When a person solves the item (i.e., xvi = 1),
the numerator becomes exp(? v − ? i ), otherwise (xvi = 0) the numerator is
exp(0) = 1 which gives the probability of an incorrect answer. In other words,
the probability of a given response is a logistic function of the respondent’s
ability relative to the item’s difficulty. It is important to note that ? v and ? i
(both ranging from –∞ to +∞) constitute latent (unobserved) parameters,
which are to be estimated from the data. For details concerning parameter
estimation see Fischer and Molenaar (1995). An important feature of the
model is that both latent parameters have the same scale and, thus, can
be directly compared. Consider the example of ? v = ? i = 0.25, that is, the
individual performance exactly matches the difficulty of the item of interest.
In this case, the probability of a correct response is
P(Xvi = 1|?v = 0.25, ?i = 0.25) =
exp(0.25 − 0.25)
= 0.5.
1 + exp(0.25 − 0.25)
Obviously, the probability for a correct response increases if ? v > ? i and
decreases if ? v < ? i . The graphical representation of this functional relation is
called the item-characteristic curve (ICC; see Figure 2). Several goodness-of-fit
tests (such as the Andersen likelihood ratio test (LRT), the Martin-Löf LRT,
and item-specific Wald tests) exist to analyze whether empirical data conform
to the Rasch model (for details see e.g., Andersen, 1973; Fischer & Molenaar,
1995; Martin-Löf, 1973). The Rasch model has the following main characteristics:
Sufficient Statistics
This characteristic refers to the fact that the sum of correctly answered or
endorsed items (so-called raw scores) contains all the information to validly
determine a respondent’s ability. Further, the sum of correct answers (or
endorsements) across individuals contains all the information needed to
validly determine item difficulty.
2. Andrich (1978) and Masters (1982) extended the model to accommodate polytomous items.
Person-Centered Analysis
11
How often during the last year have
you had a feeling of guilt or remorse after drinking?
Male
0.8
0.6
0.4
0.2
0.0
Probability to answer ‘‘at least less than monthly’’
Female
–4
Figure 2
–2
0
Latent dimension (person ability)
2
4
Item-characteristic curve (ICC) for male and female respondents.
Unidimensionality of the Scale
This characteristic states that all items are homogenous, that is, all items
measure the same latent trait of interest and predominantly one ability
determines the probability of solving or endorsing the item. Dimensional
identity is of particular importance for person-oriented research. Only if a
scale possesses dimensional identity, one can make comparative statements
in terms of differences or changes in test scores. Otherwise, observed intraor interindividual differences cannot clearly be separated from differences
in the dimensional characteristic of the scale itself.
Local Stochastic Independence
When a scale conforms to the Rasch model, it follows that for a given level
of ability the probability of solving or endorsing an item does not dependent
on answering another item.
12
EMERGING TRENDS IN THE SOCIAL AND BEHAVIORAL SCIENCES
Monotonicity of Items and Parallel ICCs
When the Rasch analysis confirms unidimensionality of a scale (i.e., homogeneity of items), the ICC of each item increases monotonically. This means
that, for a given item difficulty, the probability of solving or endorsing an
item increases with the respondent’s ability. Similarly, for a given person ability, the probability of solving or endorsing an item decreases with increasing
item difficulty. Further, the Rasch model assumes parallel ICCs, that is, ICCs
are expected to have the same slope parameter. Thus, items are not allowed
to have different item discriminations.
Specific Objectivity
If a scale conforms to the Rasch model, differences in item difficulties are
invariant across groups of respondents and differences in respondents’
abilities are invariant over sets of items. In other words, any set of items
will lead to the same differences in ability of two respondents and, similarly,
any sample of respondents will lead to the same differences in difficulty of
two items (also called sample independence). Thus, from the perspective of
person-oriented research, Rasch-conform scales are uniquely suited to make
statements of interindividual differences.
Invariance over Subgroups
This implies that estimated ability parameters for the same true score do not
differ across subgroups, which implies that subgroup membership will not
predict person scores. Violations of measurement invariance are known as
DIF. From a person-oriented research perspective, DIF violates the assumption of dimensional identity. If person ability can be predicted from group
memberships, it follows that test scores cannot be compared across individuals of these different sub-populations. The following data example demonstrates a scenario where measurement invariance is violated.
Data Example
In the following data example, we analyze alcohol consumption patterns
among university students. Alcohol consumption was measured using the
alcohol use disorder identification test (AUDIT; Babor, de la Fuente, Saunders, & Grant, 1989). The AUDIT consists of 10 items measuring the consumption, signs of dependence, and substance-related problems. The sample
consists of 651 university students (60.2% females) between 18 and 73 years
of age (M = 24.7; SD = 6.6). Overall, 97.1% of the students consumed alcoholic
beverages within the last 12 months. In this example, polytomous items were
dichotomized according to Smith and Shevlin (2008). The baseline categories
reflected scores of zero, the remaining response categories reflected a score
Person-Centered Analysis
13
of one. All computations were performed using the eRm package (Mair &
Hatzinger, 2007), which is freely available for the R software (R Core Team,
2014). For the present purpose, we focus on demonstrating DIF.
Both the Andersen LR test (? 2 (9) = 43.9, p < 0.001) and the Martin-Löf test
(? 2 (24) = 38.7, p = 0.030) suggest that the data do not conform to the Rasch
model. Item-specific Wald tests using gender as grouping variable show that
difficulty parameters of items 2 (“number of drinks on a typical day with alcohol
consumption”; z = −2.45, p = 0.014), 7 (“feeling of guilt or remorse after drinking”; z = −2.18, p = 0.029), and 10 (“concerns about the consumption from a relative, friend, or doctor”; z = 2.44, p = 0.015) significantly differ for males and
females. These results clearly suggest the existence of DIF. Figure 2 shows
the gender-specific ICCs for item 7. It can be seen that female respondents
generally show higher probabilities of reporting feelings of guilt or remorse
after alcohol consumption than males. This implies that (i) males and females
differ in their responses to this item, (ii) test scores of males and females cannot be compared, and (iii) the same test score may not necessarily indicate the
same consumption behavior. From the viewpoint that violations of subgroup
invariance have to be avoided, one may decide to remove these three items
from further analysis. However, such strategies inevitably result in artificially
generated subsets of “well-behaving” items, where it is unclear whether the
measured test scores still corresponds to the original latent trait of interest.
From a person-oriented perspective, such post-hoc adjustments hamper the
analysis of interindividual differences and, thus, important future research
questions may remain unconsidered.
Recently, Verhelst (2012) proposed a generalized form of DIF, in which
individual response profiles from predefined subsets of items are examined.
Individual profiles are then aggregated at levels of observed covariates to
analyze systematic differences. In addition to observed covariates such as
gender or ethnicity, latent (unobserved) groups may exist. The so-called
mixed Rasch model—basically a combination of mixture models and the
conventional Rasch model (see e.g., Rost, 1990)—seems well suited to
identify latent sub-populations.
CONCLUSION AND OUTLOOK
Person-oriented research comes with great promise. Individuals from different populations will not be lumped together any more. Justice will be done
to differences in development. Scales will be developed that allow valid
inter- and intraindividual comparisons. Statements made in person-oriented
research will be much more reliable and valid than statements made in
variable-oriented research. Most important, statements will be made about
people instead of variables.
14
EMERGING TRENDS IN THE SOCIAL AND BEHAVIORAL SCIENCES
First results of the person-oriented approach to research and application
are visible already (see von Eye et al., in press). Intervention and therapy
in psychotherapy and medical intervention are beginning to be tailored to
the individual case, and the probability that an intervention is successful
increases. Examples of these efforts include person-centered cancer therapy
(see, e.g., Cancer Center, 2012).
From a methodological perspective, procedures such as latent profile
analysis (Vermunt & Magidson, 2002; designed to classify individuals based
on continuous indicator responses) are now routinely applied to identify
(latent) homogeneous sub-groups of individuals. Similarly, mixture models
are increasingly applied in longitudinal research, which leads to so-called
latent class growth models (Nagin, 1999) and growth mixture models (e.g.,
Muthén & Muthén, 2000). Note that these classification procedures rely on
the assumption that the observed score distributions emerge from a mixture
of normal distributions. In other words, each latent sub-group can be
described by a group-specific normal distribution. More recently proposed
approaches relax the normality assumption and allow the identification
of latent sub-groups, which can be described by a series of potentially
asymmetric indicator distributions (Lee & McLachlan, 2014; Lin, 2009; Pyne
et al., 2009). Person-oriented research will highly benefit from the flexibility
of these promising modeling techniques.
Unfortunately, person-oriented research comes with a price tag. Research
will require more effort. Samples will have to be much larger. In longitudinal research, many more observation points are needed. Scales that possess
dimensional identity need to be developed. These tasks sure are daunting.
However, given the promises, the outcomes will be worth the efforts.
REFERENCES
Achenbach, T. M., & Edelbrock, C. (1981). Behavioral problems and competencies
reported by parents of normal and disturbed children aged 4–16. Monographs of
the Society for Research in Child Development, 46, 1–82.
Andersen, E. B. (1973). A goodness of fit test for the Rasch model. Psychometrika, 38,
123–140.
Andrich, D. (1978). A rating formulation for ordered response categories. Psychometrika, 43, 561–73.
Babor, T. F., de la Fuente, J., Saunders, J., & Grant, M. (1989). AUDIT—The alcohol use
disorder identification test: Guidelines in use for primary health care. Geneva, Switzerland: World Health Organization, Division of Mental Health.
Bergman, L. R., & Magnusson, D. (1997). A person-oriented approach in research on
developmental psychopathology. Development and Psychopathology, 9, 291–319.
Person-Centered Analysis
15
Bergman, L. R., von Eye, A., & Magnusson, D. (2006). Person-oriented research strategies in developmental psychopathology. In D. Cicchetti & D. J. Cohen (Eds.), Developmental Psychopathology (2nd ed., pp. 850–888). London, England: John Wiley &
Sons, Ltd.
Cancer Center (2012). Integrative cancer treatment. Retrieved from http://www.
cancercenter.com/integrative-treatment.cfm.
Estes, W. K. (1956). The problem of inference from curves based on group data. Psychological Bulletin, 53, 134–140.
Fischer, G. H., & Molenaar, I. W. (1995). Rasch models: Foundations, recent developments,
and applications. New York, NY: Springer.
Hand, D. J., & Vinciotti, V. (2003). Local versus global models for classification problems: Fitting models where it matters. The American Statistician, 57(2), 124–131.
Havránek, T., & Lienert, G. A. (1984). Local and regional versus global contingency
testing. Biometrical Journal, 26, 483–494.
Heilmann, W.-R., Lienert, G. A., & Maly, V. (1979). Prediction models in Configural
Frequency Analysis. Biometrical Journal, 21, 79–86.
Koller, I., Alexandrowicz, R., & Hatzinger, R. (2012). Das Rasch Modell in der Praxis:
Eine Einführung in eRm. Wien, Austria: Facultas AG.
Lambert, M. C., Schmitt, N., Samms-Vaughan, M. E., Russ, C. M., An, J. S., Fairclough, M., & Nutter, C. A. (2003). Is it prudent to administer all items for each
child behaviour checklist cross informant syndrome? Evaluation of the psychometric properties of the youth self report dimensions via confirmatory factor analysis
and item response theory. Psychological Assessment, 15, 530–568.
Lee, S. X., & McLachlan, G. J. (2014). EMMIXuskew: An R package for fitting mixtures of multivariate skew t distributions via the EM algorithm. Journal of Statistical
Software, 55(12), 1–22.
Lienert, G. A., & Krauth, J. (1975). Configural frequency analysis as a statistical tool
for defining types. Educational and Psychological Measurement, 35, 231–238.
Lin, T. I. (2009). Maximum likelihood estimation for multivariate skew normal mixture models. Journal of Multivariate Analysis, 100, 257–265.
Mair, P., & Hatzinger, R. (2007). Extended Rasch modeling: The eRm package for the
application of IRT models in R. Journal of Statistical Software, 20, 9.
Martin-Löf, P. (1973). Statistika Modeller: Anteckningar från seminarier Lasåret
1969–1970, utarbetade av Rolf Sunberg. Obetydligt ändrat nytryck, oktober 1973.
Institutet för säkringsmatematik och matematik statistik vid Stockholms universitet.
Masters, G. N. (1982). A Rasch model for partial credit scoring. Psychometrika, 47,
149–174.
Mellenbergh, G. H. (1996). Other null model, other (anti)type. Applied Psychology, 45,
329–330.
Molenaar, P. C. M., & Campbell, C. G. (2009). The new person-specific paradigm in
psychology. Current Directions in Psychological Science, 18, 112–117.
Muthén, B., & Muthén, L. K. (2000). Integrating person-centered and variablecentered analyses: Growth mixture modeling with latent trajectory classes. Alcoholism: Clinical and Experimental Research, 24, 882–891.
16
EMERGING TRENDS IN THE SOCIAL AND BEHAVIORAL SCIENCES
Nagin, D. S. (1999). Analyzing developmental trajectories: A semiparametric, groupbased approach. Psychological Methods, 4, 139–157.
Pyne, S., Hu, X., Wang, K., Rossin, W., Lin, T. I., Maier, L. M., … , Mesirow, J. P.
(2009). Automated high-dimensional flow cytometric data analysis. Proceedings of
the National Academy of Sciences USA, 106, 8519–8524.
R Core Team (2014). R: A language and environment for statistical computing. Vienna,
Austria: R Foundation for Statistical Computing. ISBN: 3-900051-07-0, http://
www.R-project.org/.
Rasch, G. (1960). Probabilistic models for some intelligence and attainment tests. Copenhagen, Denmark: Danish Institute for Educational Research.
Rost, J. (1990). Rasch models in latent classes: An integration of two approaches to
item analysis. Applied Psychological Measurement, 14, 271–282.
Salway, R. E., & Wakefield, J. C. (2005). Sources of bias in ecological studies of
non-rare events. Environmental and Ecological Statistics, 12, 321–347.
Schmitz, B. (2000). Auf der Suche nach dem verlorenen Individuum: vier Theoreme
zur Aggregation von Prozessen. Psychologische Rundschau, 51, 83–92.
Smith, G. W., & Shevlin, M. (2008). Patterns of alcohol consumption and related
behaviour in Great Britain: A latent class analysis of the alcohol use disorder identification test (AUDIT). Alcohol & Alcoholism, 43, 590–594.
Stemmler, M., Lösel, F., Beelmann, A., Jaursch, S., & Zenkert, B. (2005). Child problem
behavior in kindergarten and in primary school: A comparison between prediction configural frequency analysis and multiple regression. Psychology Science, 47,
467–478.
Sterba, S. K., & Bauer, D. J. (2010). Matching method with theory in person-oriented
developmental psychopathology research. Development and Psychopathology, 22,
239–254.
Tubman, J. T., Vicary, J. R., von Eye, A., & Lerner, J. V. (1990). Longitudinal substance
use and adult adjustment. Journal of Substance Abuse, 2, 317–334.
Verhelst, N. D. (2012). Profile analysis: A closer look at the PISA 2000 reading data.
Scandinavian Journal of Educational Research, 56, 315–332.
Vermunt, J. K., & Magidson, J. (2002). Latent class cluster analysis. In J. A. Hagenaars
& A. L. McCutcheon (Eds.), Applied latent class analysis (pp. 89–106). Cambridge,
England: Cambridge University Press.
von Eye, A. (2002). Configural Frequency Analysis—Methods, models, and applications.
Mahwah, NJ: Lawrence Erlbaum.
von Eye, A., & Bergman, L. R. (2003). Research strategies in developmental psychopathology: Dimensional identity and the person-oriented approach. Development and Psychopathology, 15, 553–580.
von Eye, A., Bergman, L. R., & Hsieh, C.-A. (in press). Person-oriented approaches in
developmental science. In W. F. Overton & P. C. M. Molenaar (Eds.), Handbook of
child psychology and developmental science—theory and methods. New York, NY: John
Wiley & Sons, Inc.
von Eye, A., & Bogat, G. A. (2006). Methods of data analysis in person-oriented
research. The sample case of ANOVA. In A. Ittel, L. Stecher, H. Merkens & J.
Zinnecker (Eds.), Jahrbuch Jugendforschung (pp. 161–182). Wiesbaden, Germany:
Verlag für Sozialwissenschaften.
Person-Centered Analysis
17
von Eye, A., & Gutiérrez-Peña, E. (2004). Configural frequency analysis—The search
for extreme cells. Journal of Applied Statistics, 31, 981–997.
von Eye, A., Mair, P., & Mun, E.-Y. (2010). Advances in configural frequency analysis.
New York, NY: Guilford Press.
Wakefield, J. C., & Salway, R. E. (2001). A statistical framework for ecological and
aggregate studies. Journal of the Royal Statistical Society, Series A, 164, 119–137.
Walls, T. A., & Schafer, J. L. (Eds.) (2006). Models for intensive longitudinal data. Oxford,
England: Oxford University Press.
ALEXANDER VON EYE SHORT BIOGRAPHY
Alexander von Eye, PhD, professor of psychology, specializes in applied
statistics and person-oriented research. In applied statistics, he focuses on
methods for the analysis of categorical data, longitudinal data, modeling,
and computational statistics. In addition, he continues to develop models for
Configural Frequency Analysis, one of the main methods in person-oriented
research. In this domain, he is involved in theoretical and methodological
developments. In addition, he explores the potential of statistical methods
of analysis for person-oriented research. His publication list comprises over
400 journal articles and book chapters, and 20 books.
WOLFGANG WIEDERMANN SHORT BIOGRAPHY
Wolfgang Wiedermann, PhD, assistant professor of psychology, specializes
in applied statistics and human development. In applied statistics, he
performs studies on the performance of statistical tests under adverse
conditions, devises new tests, studies statistical methods for dependent data
situations, and develops statistical tools for causality research. In addition,
he develops methods for the optimization of digitization. In developmental
research, he takes a life-span perspective and he is involved in studies on
fatherhood.
RELATED ESSAYS
Statistical Power Analysis (Psychology), Christopher L. Aberson
Social Epigenetics: Incorporating Epigenetic Effects as Social Cause and
Consequence (Sociology), Douglas L. Anderton and Kathleen F. Arcaro
To Flop Is Human: Inventing Better Scientific Approaches to Anticipating
Failure (Methods), Robert Boruch and Alan Ruby
Repeated Cross-Sections in Survey Data (Methods), Henry E. Brady and
Richard Johnston
Ambulatory Assessment: Methods for Studying Everyday Life (Methods),
Tamlin S. Conner and Matthias R. Mehl
18
EMERGING TRENDS IN THE SOCIAL AND BEHAVIORAL SCIENCES
Models of Nonlinear Growth (Methods), Patrick Coulombe and James P.
Selig
Hierarchical Models for Causal Effects (Methods), Avi Feller and Andrew
Gelman
Micro-Cultures (Sociology), Gary Alan Fine
Quantile Regression Methods (Methods), Bernd Fitzenberger and Ralf
Andreas Wilke
Meta-Analysis (Methods), Larry V. Hedges and Martyna Citkowicz
The Use of Geophysical Survey in Archaeology (Methods), Timothy J.
Horsley
Ethnography in the Digital Age (Methods), Alan Howard and Alexander
Mawyer
Participant Observation (Methods), Danny Jorgensen
How Brief Social-Psychological Interventions Can Cause Enduring Effects
(Methods), Dushiyanthini (Toni) Kenthirarajah and Gregory M. Walton
Network Research Experiments (Methods), Allen L. Linton and Betsy Sinclair
Longitudinal Data Analysis (Methods), Todd D. Little et al.
Structural Equation Modeling and Latent Variable Approaches (Methods),
Alex Liu
Regression Discontinuity Design (Methods), Marc Meredith and Evan
Perkoski
Data Mining (Methods), Gregg R. Murray and Anthony Scime
Ethnography: Telling Practice Stories (Methods), Karen O’Reilly
Quasi-Experiments (Methods), Charles S. Reichard
Text Analysis (Methods), Carl W. Roberts
Digital Methods for Web Research (Methods), Richard Rogers
Virtual Worlds as Laboratories (Methods), Travis L. Ross et al.
Content Analysis (Methods), Steven E. Stemler
-
Person-Centered Analysis
ALEXANDER VON EYE and WOLFGANG WIEDERMANN
Abstract
The majority of data analyses in the empirical sciences that are concerned with
humans proceeds at the level of variables. Typical results relate variables to each
other, for example, in correlational or regression-type statements. In these analyses,
individuals are considered random data carriers, replaceable without damage by
other individuals, also random data carriers. This type of research is known as
variable-oriented. It has been shown that statements at the aggregate level, that is,
variable-oriented statements, are rarely applicable to the individual case. In contrast,
person-oriented research, also known as person-centered research, proposes focusing
on the individual. Analyses in person-oriented research differ from procedures
that are customary in variable-oriented research. In person-oriented research,
parameters are estimated first at the level of the individual. If generalization is
the goal of analysis, aggregation takes place at the level of parameters instead of
raw data. Implications of this strategy are major. Data need to be collected in a
way different than in variable-oriented research, data analysis is different, and
the resulting statements are different as well. This article introduces readers to
person-oriented research and gives two examples of person-oriented data analysis,
that is, configural frequency analysis and item response modeling.
INTRODUCTION
Most empirical researchers pursue the goal of making general statements.
These are statements that are valid for populations, not just individuals. In
the pursuit of this goal, strategies of data collection have been developed,
strategies of data analysis and inference statistics have been established, and
statements that describe results are formulated such that they sound general
in the sense that they do not include terms that refer to individuals any more.
Instead, these statements, known as aggregate-level statements, contain terms
that refer to variables and their interrelations and are based on information
that is the result of aggregation at the level of raw data.
Unfortunately, and as is well known, aggregate-level results rarely describe
individuals validly, if ever. The average individual may not exist. Walls and
Schafer (2006) note that “ … the average may be highly atypical” (p. 14). This
Emerging Trends in the Social and Behavioral Sciences. Edited by Robert Scott and Stephen Kosslyn.
© 2015 John Wiley & Sons, Inc. ISBN 978-1-118-90077-2.
1
2
EMERGING TRENDS IN THE SOCIAL AND BEHAVIORAL SCIENCES
applies in particular when averages or, in general, population parameters are
estimated based on aggregated raw data. Aggregation carries the risk of distorting relations. In methodological articles, this has been discussed at least
since Estes (1956), who addressed issues concerning inference from curves
based on group data. Recent work by, for example, Molenaar and Campbell
(2009) or Salway and Wakefield (2005; cf. Wakefield & Salway, 2001) has presented statistical frameworks that allow researchers to determine whether
a given data set can meaningfully be aggregated at the level of raw data.
For examples of problems that can arise when aggregation is performed, see
Schmitz (2000) or von Eye and Bergman (2003). These examples show that in
variable-oriented analysis, (i) descriptions of processes of growth and development as well as relations among variables can be completely invalid, and
(ii) not a single case may be described validly.
To illustrate the possible distortion in conclusions from aggregated data,
we recalculate an artificial data example from von Eye, Bergman, and Hsieh
(in press). The data describe the adolescent growth spurt. The height of six
adolescents (C1 through C6) is measured nine times each. The adolescents
differ only in the timing of their growth spurts. The growth spurt itself is
the same for every individual, in particular in steepness and duration (see
Figure 1). The beginning and the end of the growth spurts shift by one observation point from C1 to C2 to C3, … , to C6. Growth, however, is equally
steep, and the duration of each spurt is the time interval between two observation points. Now, let, in an aggregation step, averaging and then estimating
the growth curve be performed. This step results in the averaged trajectory,
which is not nearly as steep as any of the individual trajectories, and suggests
that the growth spurt takes much longer. The resulting trajectory is depicted
in the curve for the average, in the last panel. This curve fails to describe any
of the individuals correctly.
In the remainder of this article, we first present the main tenets of
person-oriented research (Bergman & Magnusson, 1997; von Eye &
Bergman, 2003). We then discuss implications for design and data analysis.
Two examples of person-oriented data analyses (i.e., Configural Frequency
Analysis and Item Response Modeling) are illustrated using empirical data.
THE TENETS OF PERSON-ORIENTED RESEARCH
In 1997, Bergman and Magnusson presented the following tenets of
person-oriented research.1
1. The following paragraphs, about the tenets of person-oriented research, borrow heavily from von
Eye and Bergman (2003).
7
6
6
6
5
5
5
4
4
4
3
3
2
2
1
1
1
0
0 1 2 3 4 5 6 7 8 9 10
Time
0
0 1 2 3 4 5 6 7 8 9 10
Time
7
7
6
6
6
5
5
5
4
4
4
C6
7
3
3
2
2
1
1
1
0 1 2 3 4 5 6 7 8 9 10
Time
0
0 1 2 3 4 5 6 7 8 9 10
Time
0 1 2 3 4 5 6 7 8 9 10
Time
3
2
0
3
3
2
0
C4
C3
7
C2
7
C5
C1
Person-Centered Analysis
0
0 1 2 3 4 5 6 7 8 9 10
Time
7
6
Average
5
4
3
2
1
0
0 1 2 3 4 5 6 7 8 9 10
Time
Figure 1 Growth spurts in six adolescents (artificial data).
Functioning, process, and development of behavior are, at least in part,
specific to the individual.
Because of its complexity, the study of functioning and development necessitates taking many factors and their interrelations into
consideration.
There is lawfulness and structure both in intraindividual constancy and
change in functioning and development as well as in interindividual
differences in functioning and development.
Processes occur in a structured way and can be described in terms of
patterns of the involved factors; the meaning of the involved factors is
4
EMERGING TRENDS IN THE SOCIAL AND BEHAVIORAL SCIENCES
determined by the factors’ interactions with other factors; development
can be described as constancy and change in these patterns.
The number of differences between patterns is, in theory, infinite; the number of observed differences, however, will be small and finite.
Some patterns occur more frequently than other patterns, or more frequently than expected based on prior knowledge, assumptions, and
estimates. These patterns can be termed common types. Accordingly,
there will also be patterns that occur less often than other patterns
or less often than expected. These patterns can be termed common
antitypes.
For quantitative comparisons of individuals on the same scale and over
time, dimensional identity is required; for qualitative comparisons of individuals, dimensional identity is not required.
The first six tenets have been discussed extensively in the literature (e.g.,
Bergman, von Eye, & Magnusson, 2006; Sterba & Bauer, 2010). The seventh
tenet (dimensional identity) was added by von Eye and Bergman (2003). This
tenet states that scale values can be used for comparison of individuals only
if the scale and its items have the exact same characteristics in the individuals (or groups) to be compared. This is by no means a given, not even for
well-established scales. For example, Lambert et al. (2003) showed that the
widely used Child Behavior Check list (CBCL; Achenbach & Edelbrock, 1981)
has a different than the published dimensional structure in populations of
African-American youth and in Jamaican youth. Therefore, the same scale
value on the CBCL can have different meaning when it is observed for youths
from these three populations.
In the following sections, we review the conditions that must be fulfilled for
statements to be valid and for instruments to allow comparative statements.
Later, we discuss methods of data analysis with respect to these conditions.
SAMPLING FOR PERSON-ORIENTED RESEARCH
In person-oriented research, researchers proceed from the assumption that
multiple populations may exist (von Eye & Bogat, 2006). When these populations are known before data collection, samples are drawn from these
populations, and the sizes of these samples can be determined using standard methods of power analysis. In other cases, however, neither the number
nor the size of populations is known. These populations typically overlap, as
in the case of height distributions of men and women or visual acuity of older
and younger populations. Methods of grouping, such as finite mixture distribution decomposition, latent class analysis, or cluster analysis, are often
Person-Centered Analysis
5
used to separate these populations. It is important to realize that when multiple populations are assumed to be represented in a data set, aggregation of
raw data can result in misrepresentations such as those known from the ecological fallacy. This fallacy describes the error that is committed when results
that were created at the aggregate level are applied to individuals. Thus, the
populations in person-oriented research have to be identified and analyzed
separately.
There are at least three changes in the routines of sampling and data
analysis that result from this procedure. First, the data collector has to
make sure that each of the possible (sub)populations is large enough for
the intended methods of analysis to be applicable. This is a rough task,
considering that both number and relative size of these populations may
be unknown. Total sample sizes must, therefore, be much larger than in
standard empirical research.
Second, dimensional identity must be established to enable researchers to
make comparative statements. Differential item functioning (DIF), that is,
the population-specific performance of items (discussed in the section titled
“Item Response Theory”), can be used as the basis for separation of populations. One issue with DIF is that it represents a main reason for lack of
dimensional identity and, thus, a main reason for lack of comparability of
individuals from different populations.
Third, and this applies in particular to developmental research, the number
of data points must be large enough that parameters can be estimated reliably
and validly for the individual. This again is a daunting task because items,
questionnaires, and tests can change their characteristics over the course of
long series of administrations. If change occurs, dimensional identity can be
in jeopardy even at the level of the individual.
As far as data analysis is concerned, researchers often create two sets of
variables. The first is used to establish the existence of groupings and subpopulations. Examples include groupings that are created based on DIF. The
second group of variables is used to compare the thus established groupings
of individuals. This comparison answers the question whether the groupings that are based on one set of variables are also meaningful in the space
of different variables. If the answer to this question is yes, the grouping can
be externally valid. These two sets of variables must not overlap. If the same
variables are used to establish a grouping and to separate the groups, severe
bias is bound to result.
An example in which groupings were created based on one set of variables
that were then validated in the space of other variables can be seen in the
work by Tubman, Vicary, von Eye, and Lerner (1990). First, the authors classified adolescents based on patterns of longitudinal substance abuse. Then,
they asked whether adjustment in adulthood varies with pattern of substance
6
EMERGING TRENDS IN THE SOCIAL AND BEHAVIORAL SCIENCES
abuse. Results suggest that adjustment problems and psychiatric problems
are far more likely when an adolescent uses leisure drugs and hard drugs
longitudinally.
In the following two sections, we discuss two statistical methods that are
particularly useful in person-oriented data analysis, Configural Frequency
Analysis (CFA) and Item Response Theory (IRT). We begin with CFA.
Configural Frequency Analysis. Bergman et al. (2006) labeled CFA (Lienert &
Krauth, 1975; von Eye & Gutiérrez-Peña, 2004; von Eye, Mair, & Mun, 2010) as
most suitable for person-oriented research. Using CFA, researchers analyze
patterns of categories of variables. These patterns, also called profiles or configurations, result from crossing categorical variables. To keep the number of
configurations manageable, continuous variables are often categorized, even
dichotomized.
For each configuration, it is asked whether the number of cases that exhibit
this profile differs from the expected number. When, for a configuration,
more cases were observed than expected, this configuration is said to constitute a CFA type. When fewer cases are observed, this configuration is said
to constitute a CFA antitype. If the observed number does not deviate from
the expected, this configuration constitutes neither a type nor an antitype.
The expected number of cases for a configuration is estimated based on a
CFA base model, a probabilistic chance model. It takes all effects into account
that are NOT of interest to the researcher. If the model is rejected, at least
one of the effects that are of interest must exist. Types and antitypes indicate
where in the cross-classification the effects manifest in the form of local associations (Havránek & Lienert, 1984; Hand & Vinciotti, 2003). Most CFA base
models can be estimated using statistical models for frequency data.
To give an example of a CFA base model, consider prediction CFA (P-CFA;
Heilmann, Lienert, & Maly, 1979; von Eye et al., 2010). The base model for
P-CFA takes into account
•
•
•
the main effects of all variables;
all possible interactions among the predictor variables; and
all possible effects among the criterion variables.
If this model is rejected, types and antitypes, by necessity, reflect
predictor–criterion relations, because these are exactly the effects that
the base model did not include. Types and antitypes in P-CFA cannot reflect
relations among predictors or relations among criterion variables because
these relations are part of the base model.
Naturally, different base models can result in different types and antitypes
(Mellenbergh, 1996). If, for example, the distinction between predictor and
Person-Centered Analysis
7
criterion variables in the P-CFA example is not made, the four variables can
be analyzed under the base model of first-order CFA. This base model, also
known as the model of variable independence, takes only the main effects of
each variable into account. Types and antitypes can, under this base model,
result from any interaction. If any interaction that is not included in P-CFA
exists, the pattern of types and antitypes from first-order CFA can be expected
to differ from the pattern of types and antitypes from P-CFA, for the same
cross-classification.
Data Example
For the following example of CFA application, we recalculate the data
published by Stemmler, Lösel, Beelmann, Jaursch, and Zenkert (2005). In a
study on child problem behavior in kindergarten and elementary school,
the authors used gender (G; 1 = male, 2 = female), externalizing problems
(E), and internalizing problems (I) as predictors of classroom behavior
problems (C; E, I, and C coded as 1 = below the 75th percentile, 2 = above the
75th percentile). The authors analyzed the cross-classification of these four
variables with P-CFA. Results suggest that one prediction antitype and two
prediction types exist. The antitype suggests that fewer girls than expected
under the base model of P-CFA can be predicted to exhibit intense classroom
problems if they had low scores on both the externalizing and internalizing
scales in kindergarten.
The first type suggests that more boys than expected under the P-CFA base
model can be predicted to exhibit serious classroom problems if they exhibited externalizing problems but no internalizing problems in kindergarten.
The second type suggests that more boys than expected can be predicted
to exhibit serious classroom behavior problems in elementary school if they
scored high on both the externalizing and the internalizing scales in kindergarten. For more detail, see Table 3 in Stemmler et al. (2005).
For the reanalysis of these data, we change the research question. We ask
whether those children who score high versus low in classroom problems
differ in particular profiles on G, E, and I. The base model for this question
is specified such that it can be rejected only if classroom behavior problems
are related to one or more of the three discriminator variables. The model
includes all possible relations among discriminator variables. Therefore, it
cannot be rejected because the discriminator variables may be related to each
other. These relations are taken into account.
Using the expected cell frequencies from this base model, we compare
all patterns of high versus low in classroom problems with each other. We
use the normal approximation of the binomial test and protect 𝛼 by using
the Holland–Copenhaver procedure (von Eye, 2002). The results of this
two-group CFA appear in Table 1.
8
EMERGING TRENDS IN THE SOCIAL AND BEHAVIORAL SCIENCES
Table 1
Two-group CFA with the discriminator variables gender (G),
externalizing problems (E), and internalizing problems (I) in
kindergarten, and the grouping variable classroom problems (C) in
elementary school
Configuration
GEIC
1111
1112
1121
1122
1211
1212
1221
1222
2111
2112
2121
2122
2211
2212
2221
2222
m
98.00
21.00
138.00
10.00
29.00
8.00
39.00
3.00
31.00
14.00
18.00
6.00
12.00
8.00
10.00
2.00
Statistic
p
−.533
.296882
3.784
.000077
−.953
.170361
Type?
Discrimination Type
1.660
−2.887
.001944
−1.218
.111560
−2.974
.001470
−.053
.478696
Discrimination Type
Discrimination Type
Table 1 suggests that three discrimination types exist. The first is constituted
by configuration 1 1 2., where the dot indicates that the students with high
scores in classroom problems are compared with the students with low scores
in classroom problems. This discrimination type shows that of those male
students who exhibit low scores in externalizing but high scores in internalizing in kindergarten, far more will also show low levels of classroom problems
in elementary school than severe classroom problems. The second discrimination type is constituted by configuration 2 1 1.; this type shows that of those
female students who exhibit low scores in both externalizing and internalizing in kindergarten, far more will also show low levels of classroom problems
in elementary school than severe classroom problems. The third discrimination type is constituted by configuration 2 2 1.; this type shows that of the girls
with high levels of externalizing problems in kindergarten but low scores of
internalizing problems, relatively higher numbers will show high, not low
levels of classroom problems in elementary school.
This example can be used to highlight characteristics of CFA solutions. In
particular,
Person-Centered Analysis
9
In Table 1, the largest difference between two cell frequencies does constitute a discrimination type. This is not always the case. The main reason
for this characteristic of CFA results is that CFA focuses on discrepancies
from expectation instead of sheer size. Therefore, even relatively small differences between observed and expected frequencies can be larger than
expected, and relatively large differences can be as expected.
CFA tables are interpreted only after the base model is rejected. It is
important to note that rejection of a base model does not guarantee
that types and antitypes exist. However, when a base model describes
the data well, there will be no large discrepancies between observed
and expected data, and the search for types and antitypes becomes
pointless.
Only a selection of cells (configurations) emerges as type or antitype (or
as discrimination type). The remaining cells do not indicate significant
deviations from the base model.
From the perspective of person-oriented research, it is important to realize
that CFA results are expressed in terms of profiles that describe individuals or groups of individuals instead of relations among variables.
To compare with results from CFA, we also estimated log-linear models.
One model that describes the data well includes all main effects and the
interactions between (i) externalizing and classroom behavior problems
and (ii) gender and classroom behavior problems. This result certainly is
plausible and interpretable, but one clearly needs CFA to identify those
sectors of the data space that represent the local associations among the
variables that span the cross-classification in Table 1. We conclude that
variable- and person-oriented strategies of data analysis can be used in a
complementary way.
In the next section, we describe the characteristics of IRT models with
respect to person-oriented research.
Item Response Theory. The comparison of individuals on the same scale
requires dimensional identity of the scale, that is, the items of a scale must
have the same characteristics across individuals (or groups). IRT, as an
umbrella term for a broader family of logistic models, seems well suited to
meet this prerequisite. The following section introduces the basic logistic
model and discusses its properties with a special focus on person-oriented
research (see also von Eye et al., in press). A data example is given analyzing
alcohol consumption patterns among university students.
The basic one-parameter logistic model, known as the Rasch model (Fischer & Molenaar, 1995; Koller, Alexandrowicz, & Hatzinger, 2012; Rasch,
10
EMERGING TRENDS IN THE SOCIAL AND BEHAVIORAL SCIENCES
1960), can be used to convert binary outcome variables2 (e.g., 0 = item
not endorsed/incorrect answer, 1 = item endorsed/correct answer) into
quantitative estimates of item difficulties and individual performances in
terms of the same equal-interval units. Let xvi be the observed response of
the random variable Xvi of person v answering item i. The Rasch model
states that the probability of xvi can be expressed as
P(Xvi = xvi |𝜃v , 𝛽i ) =
exp[xvi (𝜃v − 𝛽i )]
,
1 + exp(𝜃v − 𝛽i )
where 𝜃 v represents the (latent) ability of person v and 𝛽 i represents the
(latent) difficulty of item i. When a person solves the item (i.e., xvi = 1),
the numerator becomes exp(𝜃 v − 𝛽 i ), otherwise (xvi = 0) the numerator is
exp(0) = 1 which gives the probability of an incorrect answer. In other words,
the probability of a given response is a logistic function of the respondent’s
ability relative to the item’s difficulty. It is important to note that 𝜃 v and 𝛽 i
(both ranging from –∞ to +∞) constitute latent (unobserved) parameters,
which are to be estimated from the data. For details concerning parameter
estimation see Fischer and Molenaar (1995). An important feature of the
model is that both latent parameters have the same scale and, thus, can
be directly compared. Consider the example of 𝜃 v = 𝛽 i = 0.25, that is, the
individual performance exactly matches the difficulty of the item of interest.
In this case, the probability of a correct response is
P(Xvi = 1|𝜃v = 0.25, 𝛽i = 0.25) =
exp(0.25 − 0.25)
= 0.5.
1 + exp(0.25 − 0.25)
Obviously, the probability for a correct response increases if 𝜃 v > 𝛽 i and
decreases if 𝜃 v < 𝛽 i . The graphical representation of this functional relation is
called the item-characteristic curve (ICC; see Figure 2). Several goodness-of-fit
tests (such as the Andersen likelihood ratio test (LRT), the Martin-Löf LRT,
and item-specific Wald tests) exist to analyze whether empirical data conform
to the Rasch model (for details see e.g., Andersen, 1973; Fischer & Molenaar,
1995; Martin-Löf, 1973). The Rasch model has the following main characteristics:
Sufficient Statistics
This characteristic refers to the fact that the sum of correctly answered or
endorsed items (so-called raw scores) contains all the information to validly
determine a respondent’s ability. Further, the sum of correct answers (or
endorsements) across individuals contains all the information needed to
validly determine item difficulty.
2. Andrich (1978) and Masters (1982) extended the model to accommodate polytomous items.
Person-Centered Analysis
11
How often during the last year have
you had a feeling of guilt or remorse after drinking?
Male
0.8
0.6
0.4
0.2
0.0
Probability to answer ‘‘at least less than monthly’’
Female
–4
Figure 2
–2
0
Latent dimension (person ability)
2
4
Item-characteristic curve (ICC) for male and female respondents.
Unidimensionality of the Scale
This characteristic states that all items are homogenous, that is, all items
measure the same latent trait of interest and predominantly one ability
determines the probability of solving or endorsing the item. Dimensional
identity is of particular importance for person-oriented research. Only if a
scale possesses dimensional identity, one can make comparative statements
in terms of differences or changes in test scores. Otherwise, observed intraor interindividual differences cannot clearly be separated from differences
in the dimensional characteristic of the scale itself.
Local Stochastic Independence
When a scale conforms to the Rasch model, it follows that for a given level
of ability the probability of solving or endorsing an item does not dependent
on answering another item.
12
EMERGING TRENDS IN THE SOCIAL AND BEHAVIORAL SCIENCES
Monotonicity of Items and Parallel ICCs
When the Rasch analysis confirms unidimensionality of a scale (i.e., homogeneity of items), the ICC of each item increases monotonically. This means
that, for a given item difficulty, the probability of solving or endorsing an
item increases with the respondent’s ability. Similarly, for a given person ability, the probability of solving or endorsing an item decreases with increasing
item difficulty. Further, the Rasch model assumes parallel ICCs, that is, ICCs
are expected to have the same slope parameter. Thus, items are not allowed
to have different item discriminations.
Specific Objectivity
If a scale conforms to the Rasch model, differences in item difficulties are
invariant across groups of respondents and differences in respondents’
abilities are invariant over sets of items. In other words, any set of items
will lead to the same differences in ability of two respondents and, similarly,
any sample of respondents will lead to the same differences in difficulty of
two items (also called sample independence). Thus, from the perspective of
person-oriented research, Rasch-conform scales are uniquely suited to make
statements of interindividual differences.
Invariance over Subgroups
This implies that estimated ability parameters for the same true score do not
differ across subgroups, which implies that subgroup membership will not
predict person scores. Violations of measurement invariance are known as
DIF. From a person-oriented research perspective, DIF violates the assumption of dimensional identity. If person ability can be predicted from group
memberships, it follows that test scores cannot be compared across individuals of these different sub-populations. The following data example demonstrates a scenario where measurement invariance is violated.
Data Example
In the following data example, we analyze alcohol consumption patterns
among university students. Alcohol consumption was measured using the
alcohol use disorder identification test (AUDIT; Babor, de la Fuente, Saunders, & Grant, 1989). The AUDIT consists of 10 items measuring the consumption, signs of dependence, and substance-related problems. The sample
consists of 651 university students (60.2% females) between 18 and 73 years
of age (M = 24.7; SD = 6.6). Overall, 97.1% of the students consumed alcoholic
beverages within the last 12 months. In this example, polytomous items were
dichotomized according to Smith and Shevlin (2008). The baseline categories
reflected scores of zero, the remaining response categories reflected a score
Person-Centered Analysis
13
of one. All computations were performed using the eRm package (Mair &
Hatzinger, 2007), which is freely available for the R software (R Core Team,
2014). For the present purpose, we focus on demonstrating DIF.
Both the Andersen LR test (𝜒 2 (9) = 43.9, p < 0.001) and the Martin-Löf test
(𝜒 2 (24) = 38.7, p = 0.030) suggest that the data do not conform to the Rasch
model. Item-specific Wald tests using gender as grouping variable show that
difficulty parameters of items 2 (“number of drinks on a typical day with alcohol
consumption”; z = −2.45, p = 0.014), 7 (“feeling of guilt or remorse after drinking”; z = −2.18, p = 0.029), and 10 (“concerns about the consumption from a relative, friend, or doctor”; z = 2.44, p = 0.015) significantly differ for males and
females. These results clearly suggest the existence of DIF. Figure 2 shows
the gender-specific ICCs for item 7. It can be seen that female respondents
generally show higher probabilities of reporting feelings of guilt or remorse
after alcohol consumption than males. This implies that (i) males and females
differ in their responses to this item, (ii) test scores of males and females cannot be compared, and (iii) the same test score may not necessarily indicate the
same consumption behavior. From the viewpoint that violations of subgroup
invariance have to be avoided, one may decide to remove these three items
from further analysis. However, such strategies inevitably result in artificially
generated subsets of “well-behaving” items, where it is unclear whether the
measured test scores still corresponds to the original latent trait of interest.
From a person-oriented perspective, such post-hoc adjustments hamper the
analysis of interindividual differences and, thus, important future research
questions may remain unconsidered.
Recently, Verhelst (2012) proposed a generalized form of DIF, in which
individual response profiles from predefined subsets of items are examined.
Individual profiles are then aggregated at levels of observed covariates to
analyze systematic differences. In addition to observed covariates such as
gender or ethnicity, latent (unobserved) groups may exist. The so-called
mixed Rasch model—basically a combination of mixture models and the
conventional Rasch model (see e.g., Rost, 1990)—seems well suited to
identify latent sub-populations.
CONCLUSION AND OUTLOOK
Person-oriented research comes with great promise. Individuals from different populations will not be lumped together any more. Justice will be done
to differences in development. Scales will be developed that allow valid
inter- and intraindividual comparisons. Statements made in person-oriented
research will be much more reliable and valid than statements made in
variable-oriented research. Most important, statements will be made about
people instead of variables.
14
EMERGING TRENDS IN THE SOCIAL AND BEHAVIORAL SCIENCES
First results of the person-oriented approach to research and application
are visible already (see von Eye et al., in press). Intervention and therapy
in psychotherapy and medical intervention are beginning to be tailored to
the individual case, and the probability that an intervention is successful
increases. Examples of these efforts include person-centered cancer therapy
(see, e.g., Cancer Center, 2012).
From a methodological perspective, procedures such as latent profile
analysis (Vermunt & Magidson, 2002; designed to classify individuals based
on continuous indicator responses) are now routinely applied to identify
(latent) homogeneous sub-groups of individuals. Similarly, mixture models
are increasingly applied in longitudinal research, which leads to so-called
latent class growth models (Nagin, 1999) and growth mixture models (e.g.,
Muthén & Muthén, 2000). Note that these classification procedures rely on
the assumption that the observed score distributions emerge from a mixture
of normal distributions. In other words, each latent sub-group can be
described by a group-specific normal distribution. More recently proposed
approaches relax the normality assumption and allow the identification
of latent sub-groups, which can be described by a series of potentially
asymmetric indicator distributions (Lee & McLachlan, 2014; Lin, 2009; Pyne
et al., 2009). Person-oriented research will highly benefit from the flexibility
of these promising modeling techniques.
Unfortunately, person-oriented research comes with a price tag. Research
will require more effort. Samples will have to be much larger. In longitudinal research, many more observation points are needed. Scales that possess
dimensional identity need to be developed. These tasks sure are daunting.
However, given the promises, the outcomes will be worth the efforts.
REFERENCES
Achenbach, T. M., & Edelbrock, C. (1981). Behavioral problems and competencies
reported by parents of normal and disturbed children aged 4–16. Monographs of
the Society for Research in Child Development, 46, 1–82.
Andersen, E. B. (1973). A goodness of fit test for the Rasch model. Psychometrika, 38,
123–140.
Andrich, D. (1978). A rating formulation for ordered response categories. Psychometrika, 43, 561–73.
Babor, T. F., de la Fuente, J., Saunders, J., & Grant, M. (1989). AUDIT—The alcohol use
disorder identification test: Guidelines in use for primary health care. Geneva, Switzerland: World Health Organization, Division of Mental Health.
Bergman, L. R., & Magnusson, D. (1997). A person-oriented approach in research on
developmental psychopathology. Development and Psychopathology, 9, 291–319.
Person-Centered Analysis
15
Bergman, L. R., von Eye, A., & Magnusson, D. (2006). Person-oriented research strategies in developmental psychopathology. In D. Cicchetti & D. J. Cohen (Eds.), Developmental Psychopathology (2nd ed., pp. 850–888). London, England: John Wiley &
Sons, Ltd.
Cancer Center (2012). Integrative cancer treatment. Retrieved from http://www.
cancercenter.com/integrative-treatment.cfm.
Estes, W. K. (1956). The problem of inference from curves based on group data. Psychological Bulletin, 53, 134–140.
Fischer, G. H., & Molenaar, I. W. (1995). Rasch models: Foundations, recent developments,
and applications. New York, NY: Springer.
Hand, D. J., & Vinciotti, V. (2003). Local versus global models for classification problems: Fitting models where it matters. The American Statistician, 57(2), 124–131.
Havránek, T., & Lienert, G. A. (1984). Local and regional versus global contingency
testing. Biometrical Journal, 26, 483–494.
Heilmann, W.-R., Lienert, G. A., & Maly, V. (1979). Prediction models in Configural
Frequency Analysis. Biometrical Journal, 21, 79–86.
Koller, I., Alexandrowicz, R., & Hatzinger, R. (2012). Das Rasch Modell in der Praxis:
Eine Einführung in eRm. Wien, Austria: Facultas AG.
Lambert, M. C., Schmitt, N., Samms-Vaughan, M. E., Russ, C. M., An, J. S., Fairclough, M., & Nutter, C. A. (2003). Is it prudent to administer all items for each
child behaviour checklist cross informant syndrome? Evaluation of the psychometric properties of the youth self report dimensions via confirmatory factor analysis
and item response theory. Psychological Assessment, 15, 530–568.
Lee, S. X., & McLachlan, G. J. (2014). EMMIXuskew: An R package for fitting mixtures of multivariate skew t distributions via the EM algorithm. Journal of Statistical
Software, 55(12), 1–22.
Lienert, G. A., & Krauth, J. (1975). Configural frequency analysis as a statistical tool
for defining types. Educational and Psychological Measurement, 35, 231–238.
Lin, T. I. (2009). Maximum likelihood estimation for multivariate skew normal mixture models. Journal of Multivariate Analysis, 100, 257–265.
Mair, P., & Hatzinger, R. (2007). Extended Rasch modeling: The eRm package for the
application of IRT models in R. Journal of Statistical Software, 20, 9.
Martin-Löf, P. (1973). Statistika Modeller: Anteckningar från seminarier Lasåret
1969–1970, utarbetade av Rolf Sunberg. Obetydligt ändrat nytryck, oktober 1973.
Institutet för säkringsmatematik och matematik statistik vid Stockholms universitet.
Masters, G. N. (1982). A Rasch model for partial credit scoring. Psychometrika, 47,
149–174.
Mellenbergh, G. H. (1996). Other null model, other (anti)type. Applied Psychology, 45,
329–330.
Molenaar, P. C. M., & Campbell, C. G. (2009). The new person-specific paradigm in
psychology. Current Directions in Psychological Science, 18, 112–117.
Muthén, B., & Muthén, L. K. (2000). Integrating person-centered and variablecentered analyses: Growth mixture modeling with latent trajectory classes. Alcoholism: Clinical and Experimental Research, 24, 882–891.
16
EMERGING TRENDS IN THE SOCIAL AND BEHAVIORAL SCIENCES
Nagin, D. S. (1999). Analyzing developmental trajectories: A semiparametric, groupbased approach. Psychological Methods, 4, 139–157.
Pyne, S., Hu, X., Wang, K., Rossin, W., Lin, T. I., Maier, L. M., … , Mesirow, J. P.
(2009). Automated high-dimensional flow cytometric data analysis. Proceedings of
the National Academy of Sciences USA, 106, 8519–8524.
R Core Team (2014). R: A language and environment for statistical computing. Vienna,
Austria: R Foundation for Statistical Computing. ISBN: 3-900051-07-0, http://
www.R-project.org/.
Rasch, G. (1960). Probabilistic models for some intelligence and attainment tests. Copenhagen, Denmark: Danish Institute for Educational Research.
Rost, J. (1990). Rasch models in latent classes: An integration of two approaches to
item analysis. Applied Psychological Measurement, 14, 271–282.
Salway, R. E., & Wakefield, J. C. (2005). Sources of bias in ecological studies of
non-rare events. Environmental and Ecological Statistics, 12, 321–347.
Schmitz, B. (2000). Auf der Suche nach dem verlorenen Individuum: vier Theoreme
zur Aggregation von Prozessen. Psychologische Rundschau, 51, 83–92.
Smith, G. W., & Shevlin, M. (2008). Patterns of alcohol consumption and related
behaviour in Great Britain: A latent class analysis of the alcohol use disorder identification test (AUDIT). Alcohol & Alcoholism, 43, 590–594.
Stemmler, M., Lösel, F., Beelmann, A., Jaursch, S., & Zenkert, B. (2005). Child problem
behavior in kindergarten and in primary school: A comparison between prediction configural frequency analysis and multiple regression. Psychology Science, 47,
467–478.
Sterba, S. K., & Bauer, D. J. (2010). Matching method with theory in person-oriented
developmental psychopathology research. Development and Psychopathology, 22,
239–254.
Tubman, J. T., Vicary, J. R., von Eye, A., & Lerner, J. V. (1990). Longitudinal substance
use and adult adjustment. Journal of Substance Abuse, 2, 317–334.
Verhelst, N. D. (2012). Profile analysis: A closer look at the PISA 2000 reading data.
Scandinavian Journal of Educational Research, 56, 315–332.
Vermunt, J. K., & Magidson, J. (2002). Latent class cluster analysis. In J. A. Hagenaars
& A. L. McCutcheon (Eds.), Applied latent class analysis (pp. 89–106). Cambridge,
England: Cambridge University Press.
von Eye, A. (2002). Configural Frequency Analysis—Methods, models, and applications.
Mahwah, NJ: Lawrence Erlbaum.
von Eye, A., & Bergman, L. R. (2003). Research strategies in developmental psychopathology: Dimensional identity and the person-oriented approach. Development and Psychopathology, 15, 553–580.
von Eye, A., Bergman, L. R., & Hsieh, C.-A. (in press). Person-oriented approaches in
developmental science. In W. F. Overton & P. C. M. Molenaar (Eds.), Handbook of
child psychology and developmental science—theory and methods. New York, NY: John
Wiley & Sons, Inc.
von Eye, A., & Bogat, G. A. (2006). Methods of data analysis in person-oriented
research. The sample case of ANOVA. In A. Ittel, L. Stecher, H. Merkens & J.
Zinnecker (Eds.), Jahrbuch Jugendforschung (pp. 161–182). Wiesbaden, Germany:
Verlag für Sozialwissenschaften.
Person-Centered Analysis
17
von Eye, A., & Gutiérrez-Peña, E. (2004). Configural frequency analysis—The search
for extreme cells. Journal of Applied Statistics, 31, 981–997.
von Eye, A., Mair, P., & Mun, E.-Y. (2010). Advances in configural frequency analysis.
New York, NY: Guilford Press.
Wakefield, J. C., & Salway, R. E. (2001). A statistical framework for ecological and
aggregate studies. Journal of the Royal Statistical Society, Series A, 164, 119–137.
Walls, T. A., & Schafer, J. L. (Eds.) (2006). Models for intensive longitudinal data. Oxford,
England: Oxford University Press.
ALEXANDER VON EYE SHORT BIOGRAPHY
Alexander von Eye, PhD, professor of psychology, specializes in applied
statistics and person-oriented research. In applied statistics, he focuses on
methods for the analysis of categorical data, longitudinal data, modeling,
and computational statistics. In addition, he continues to develop models for
Configural Frequency Analysis, one of the main methods in person-oriented
research. In this domain, he is involved in theoretical and methodological
developments. In addition, he explores the potential of statistical methods
of analysis for person-oriented research. His publication list comprises over
400 journal articles and book chapters, and 20 books.
WOLFGANG WIEDERMANN SHORT BIOGRAPHY
Wolfgang Wiedermann, PhD, assistant professor of psychology, specializes
in applied statistics and human development. In applied statistics, he
performs studies on the performance of statistical tests under adverse
conditions, devises new tests, studies statistical methods for dependent data
situations, and develops statistical tools for causality research. In addition,
he develops methods for the optimization of digitization. In developmental
research, he takes a life-span perspective and he is involved in studies on
fatherhood.
RELATED ESSAYS
Statistical Power Analysis (Psychology), Christopher L. Aberson
Social Epigenetics: Incorporating Epigenetic Effects as Social Cause and
Consequence (Sociology), Douglas L. Anderton and Kathleen F. Arcaro
To Flop Is Human: Inventing Better Scientific Approaches to Anticipating
Failure (Methods), Robert Boruch and Alan Ruby
Repeated Cross-Sections in Survey Data (Methods), Henry E. Brady and
Richard Johnston
Ambulatory Assessment: Methods for Studying Everyday Life (Methods),
Tamlin S. Conner and Matthias R. Mehl
18
EMERGING TRENDS IN THE SOCIAL AND BEHAVIORAL SCIENCES
Models of Nonlinear Growth (Methods), Patrick Coulombe and James P.
Selig
Hierarchical Models for Causal Effects (Methods), Avi Feller and Andrew
Gelman
Micro-Cultures (Sociology), Gary Alan Fine
Quantile Regression Methods (Methods), Bernd Fitzenberger and Ralf
Andreas Wilke
Meta-Analysis (Methods), Larry V. Hedges and Martyna Citkowicz
The Use of Geophysical Survey in Archaeology (Methods), Timothy J.
Horsley
Ethnography in the Digital Age (Methods), Alan Howard and Alexander
Mawyer
Participant Observation (Methods), Danny Jorgensen
How Brief Social-Psychological Interventions Can Cause Enduring Effects
(Methods), Dushiyanthini (Toni) Kenthirarajah and Gregory M. Walton
Network Research Experiments (Methods), Allen L. Linton and Betsy Sinclair
Longitudinal Data Analysis (Methods), Todd D. Little et al.
Structural Equation Modeling and Latent Variable Approaches (Methods),
Alex Liu
Regression Discontinuity Design (Methods), Marc Meredith and Evan
Perkoski
Data Mining (Methods), Gregg R. Murray and Anthony Scime
Ethnography: Telling Practice Stories (Methods), Karen O’Reilly
Quasi-Experiments (Methods), Charles S. Reichard
Text Analysis (Methods), Carl W. Roberts
Digital Methods for Web Research (Methods), Richard Rogers
Virtual Worlds as Laboratories (Methods), Travis L. Ross et al.
Content Analysis (Methods), Steven E. Stemler