Household Wealth Effects and the US Macroeconomy
Media
Part of Household Wealth Effects and the US Macroeconomy
- Title
- Household Wealth Effects and the US Macroeconomy
- extracted text
-
Household Wealth Effects
and the US Macroeconomy
KAREN DYNAN and DANIEL COOPER
Abstract
The effect of wealth on consumption is an issue of long-standing interest to
economists. Analysts believe that fluctuations in household wealth have driven
major swings in economic activity. This essay considers the so-called “wealth
effects”—the impact of changes in wealth on household consumption and the
overall macroeconomy. There is an extensive existing literature on wealth effects,
but there are also many unanswered issues and questions. This essay reviews the
important issues regarding the role wealth plays in the macroeconomy and argues
that there is a need for much more wealth effect research as well as better data
sources for conducting such analysis.
The effect of wealth on consumption is an issue of long-standing interest to economists. The relationship has been particularly important from a
policy perspective since the mid-1990s, as the US economy has since experienced two major booms and busts in stock prices, as well as a dramatic
run-up and reversal of home prices. Analysts believe that the resulting fluctuations in household wealth have driven major swings in the US economic
activity. Indeed, the plunge in household wealth during the financial crisis is
frequently cited as contributing importantly to the unusually slow recovery
of the US economy from the Great Recession.
Against this backdrop, it is perhaps not surprising that a great deal of
empirical research over the last 25 years has focused on the so-called “wealth
effects”—the impact of changes in wealth on household consumption and
the overall macroeconomy. Such studies have used different types of data to
examine the relationship between wealth and household spending, including macroeconomic time series, regional data, household survey results, and
credit bureau records. Despite this attention from the research community,
many important questions about wealth effects remain unanswered. We
Emerging Trends in the Social and Behavioral Sciences. Edited by Robert Scott and Stephen Kosslyn.
© 2015 John Wiley & Sons, Inc. ISBN 978-1-118-90077-2.
1
2
EMERGING TRENDS IN THE SOCIAL AND BEHAVIORAL SCIENCES
review these questions, arguing that there is a pressing need for more
research in the area as well as a need to develop better data sources for such
research.
BACKGROUND
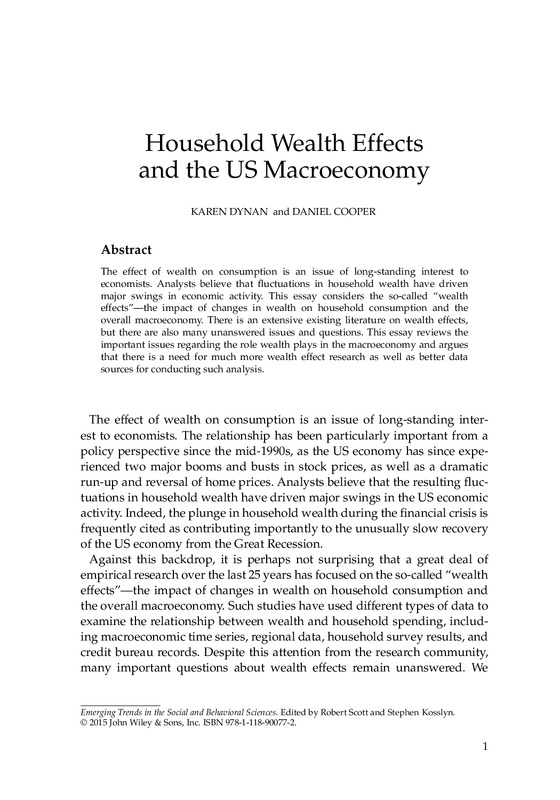
The swings in the US household wealth over the last two decades began with
a run-up in stock prices in the late 1990s, as shown in Figure 1, driven in
large part by optimism over the potential for new technologies to raise the
productivity of US businesses. Market confidence collapsed in early 2000,
and stock prices subsequently retreated as the US economy experienced a
mild recession. By mid-2003, though, employment conditions began to show
decided improvements amid robust economic growth, and the United States
thereafter saw several years of rapidly rising stock and home prices.
Unfortunately, the prosperity proved to be transitory. Home prices, which
had risen well above the levels justified by fundamentals, began to edge
down in 2006 and were sharply declining by the following year. Delinquency
rates on mortgages rose, starting with the so-called “affordable” mortgages,
many of which were fundamentally unsustainable in the absence of continued home price appreciation, leading to a tightening of credit conditions,
further investor losses, and, ultimately, the most severe financial crisis and
economic downturn in the United States since the Great Depression. By
early 2009, the value of stocks held by households was down roughly 50%
200
150
100
50
0
1990q1
Case–Shiller index
1500
1000
500
S&P 500 index
2000
Stock and house prices
1995q1
2000q1
S&P 500
2005q1
2010q1
2015q1
Case–Shiller index
Figure 1 Stock prices and house prices. Source: Standard and Poor’s, Wall
Street Journal/ Haver Analytics.
Household Wealth Effects and the US Macroeconomy
3
5.5
4.5
5
Ratio
6
6.5
Net worth to income
1980q1 1985q1 1990q1 1995q1 2000q1 2005q1 2010q1 2015q1
Figure 2 Net worth-to-income ratio. Source: Federal Reserve Board, BEA/Haver
Analytics.
from its peak, and the value of real estate owned by households was down
roughly 25%.
The evolution of US household wealth clearly shows the imprint of these
dramatic movements in asset prices, as shown in Figure 2. The stock price
bubble of the late 1990s propelled the aggregate ratio of household wealth to
disposable personal income from less than 5 to 6.2 at its peak around 2000.
After taking back most of these gains in the early 2000s, the ratio shot up
again during the housing boom, reaching 6.5 in 2006 before tumbling to its
lowest level in about 15 years. The recovery in stock prices since their low
point in early 2009 has brought the ratio of household wealth-to-income back
up to a level roughly comparable to 1997.
According to conventional wisdom, these swings in household wealth
have been important drivers of economic activity in the United States, and
policy-related discussions often reference the relationship. For example, in
its February 1996 Monetary Policy Report to Congress, the Federal Reserve
noted, “In the household sector, the accumulation of financial wealth
brought on by the rise in the stock market has provided the wherewithal
for increases in consumption greater than would otherwise have been
expected—countering the potential negative influences of more burdensome levels of consumer debt.” In a 2002 speech, then Federal Reserve
Governor Edward Gramlich remarked, “. . .the link between aggregate
household wealth and spending has remained one of the sturdier empirical
relationships in macroeconomics.” The 2013 Economic Report of the President
stated, “A total of $16 trillion in wealth was erased by the financial and
4
EMERGING TRENDS IN THE SOCIAL AND BEHAVIORAL SCIENCES
housing crisis, causing families to pull back on spending plans, reduce
personal debt and increase savings, in turn leading companies to cut back
hiring, lay off valued employees, and halt investment plans.”
ESTIMATING WEALTH EFFECTS USING MACRO DATA: BASIC
RESULTS AND LIMITATIONS
Standard economic theory (the Permanent Income Hypothesis) offers a
framework for thinking about wealth effects. In particular, households
should consume a constant fraction of their (appropriately calculated)
lifetime resources. Changes in wealth that permanently alter the households’ lifetime resources therefore should cause consumption to change.
This posited relationship is consistent with the strong positive correlation
seen when the aggregate “consumption rate” (consumption as a share
of disposable personal income) is plotted against the ratio of aggregate
household wealth to disposable personal income (Figure 3).
More formal modeling of the relationship between aggregate consumption
and aggregate household wealth has produced estimates of the timing and
magnitude of the wealth effect. Davis and Palumbo (2001) present an analysis
based on typical consumption forecasting models and conclude that consumer spending rises by between 3 and 6 cents for every additional dollar
of wealth, with the effect occurring gradually over a period of several years
(see also Carroll, Otsuka, & Slacalek, 2011).
4
2
0
–2
4-quarter percent change
10
0
–10
–20
4-quarter percent change
6
20
Changes in net worth and consumption
1980q1 1985q1 1990q1 1995q1 2000q1 2005q1 2010q1 2015q1
Net worth
Real consumption
Figure 3 Consumption and net worth. Source: Federal Reserve Board, BEA/
Haver Analytics.
Household Wealth Effects and the US Macroeconomy
5
While macroeconometric models provide useful guidance on the average
historical relationship between aggregate consumption and wealth, they also
have limitations. In particular, the degree to which the models are useful for
forecasting aggregate consumption dynamics or uncovering key economic
relationships depends on the degree to which household behavior is homogeneous as well as the degree to which changes to the economic environment
are distributed evenly and consistently over time. In practice, these conditions are not met: the actual economy is characterized by heterogeneity that
is not consistent over time.
In the existing wealth effects literature, much attention has focused on
credit constraints as a potential source of heterogeneity in how different
households respond to changes in wealth. In particular, households that
are consuming at a suboptimal level because they cannot borrow as much
as they desire should have a particularly powerful consumption response
to wealth gains (at least to the extent that those gains can be liquefied).
Indeed, Lehnert (2004) estimated higher propensities to consume out of
housing wealth for younger US households than their older counterparts,
arguing that the former group was the most likely to be constrained. Bostic,
Gabriel, and Painter (2009) also find that borrowing constraints impact
the relationship between wealth and consumption. In a somewhat more
recent work, Cooper (2013) used several alternative approaches to show
that borrowing constraints heighten the relationship between consumption
and housing wealth in US household-level data. Finally, using spending
and balance sheet data at the regional level, Mian, Rao, and Sufi (2013) find
substantially higher propensities to consume for poorer and more levered
households—again, the groups most likely to be constrained. Although the
precise results differ from essay to essay, the findings in these studies are
strongly consistent with the view that housing wealth effects are larger for
households that are more likely to be facing borrowing constraints (see also
Case, Quigley, & Shiller, 2005, 2011, 2013).
The geographic dispersion of the housing wealth movements over the last
decade represents another possible source of heterogeneity in wealth effects.
Figure 4 shows the wide dispersion of home price appreciation across states
from 2002 to 2006. For the most part, the subsequent housing bust was similarly concentrated. This distribution should be relevant for the strength of
the aggregate wealth effect, given that different states have different demographic characteristics, which should affect the response of consumption to
wealth (e.g., one might expect a stronger effect in states where people are in
demographic groups more likely to be borrowing constrained).
These types of heterogeneity do not in and of themselves invalidate analyses of wealth effects based on macroeconomic models. If aggregate wealth
changes always had the same distribution across people and space, then the
6
EMERGING TRENDS IN THE SOCIAL AND BEHAVIORAL SCIENCES
0–20%
20–40%
40–60%
>60%
Figure 4 House price changes by state (2002–2006). Source: FHFA/Haver
Analytics.
estimated coefficients from the models—which essentially reflect the average historical relationship between wealth and consumption—would well
capture the expected response to a new change in wealth. But, in fact, the distribution of aggregate wealth changes across different types of people is not
consistent over time, varying because of differences in the types of wealth
held and also because the fraction of people having a certain trait (such as
being borrowing constrained) can change. The spatial dispersion of wealth
shocks also varies over time. For example, real house prices surged 39% in the
Boston Metropolitan Statistical Area (MSA) between 1984 and 1986 as part of
a coastal housing boom at that time. In comparison, real house price appreciation was only about 8.5% in the Chicago MSA and 4.3% in the Kansas City
MSA over this period.
KEY UNRESOLVED ISSUES REGARDING WEALTH EFFECTS
The previous discussion of the limitations of the standard approach to modeling wealth effects highlights the need to know much more about the underpinnings of wealth effects at the household level. In this section, we discuss
the outstanding questions that are most important from a policy perspective,
reviewing where the literature currently stands and where more research
would be helpful.
IS HOUSING WEALTH REALLY WEALTH?
The recent boom and bust in US home prices has spurred interest in how
housing wealth influences the macroeconomy, and, in particular, whether
housing wealth has the same effect on households’ spending decisions as
Household Wealth Effects and the US Macroeconomy
7
financial wealth. To this point, Buiter (2010) argues that housing wealth is not
really wealth. The underlying intuition is that housing wealth differs from
other household (financial) wealth, because it serves both as an asset and as
a consumption good. As a result, when home prices rise, the ownership (or
rental) costs of housing also increase.
Renters are unambiguously worse off when the cost of housing consumption increases, because, for a given amount of income, they must reduce
their consumption of nonhousing goods in order to offset the higher cost of
their shelter. The impact of home appreciation on homeowners is less clear,
as higher housing costs require homeowners to decrease their nonhousing
consumption for a given amount of income, but they receive an offsetting
capital gain from the higher home prices. If housing costs do not increase
one-for-one with home price appreciation, then homeowners could be better
off when house prices rise. Typically, though, economists think that housing
costs and house prices move together; so, homeowners’ actual wealth gains
from house price appreciation may be small or nonexistent. Moreover,
homeowners may have to reoptimize and downsize their housing stock in
order to fully realize their gains for consumption purposes—something that
many owners may not be willing to do, given transaction costs and other
factors, especially in the short-term.
Housing wealth may, however, impact consumption indirectly through its
role as borrowing collateral. When home prices rise, the value of homeowners’ collateral increases, and they can borrow against their additional home
equity such that they can spend more on goods and services (including
home improvements) and meet other financial needs. Previously constrained
homeowners are therefore likely to increase their spending when house
prices rise. In the data, this borrowing collateral effect should show up as a
positive relationship between housing wealth and consumption.
Further, as Case, Quigley, and Shiller (2013) argue, homeowners may
increase their consumption in response to housing appreciation for psychological reasons. That is, they may respond to societal perceptions that
housing gains make them better off or they may be myopic and fail to
consider that if everyone in their area experiences similar housing gains
they are not necessarily any better off.
At the aggregate level, we might also expect to see changes in housing
wealth have a different effect on consumption than changes in financial
wealth because of its different distribution across households. Table 1
shows that roughly two-thirds of households own homes, while only
about half hold stocks (including stocks held indirectly through mutual
funds, defined-contribution retirement plans, and the like). The data come
from the Survey of Consumer Finances (SCF), weighted to be nationally
representative. Because the SCF oversamples wealthy households who are
8
EMERGING TRENDS IN THE SOCIAL AND BEHAVIORAL SCIENCES
Table 1
Ownership Rates by the Type of Asset
Year
Housing
Stocks
2001
2004
2007
2010
66.9
68.4
67.9
64.6
52.3
50.3
53.2
49.9
Source: Survey of Consumer Finances and authors’ calculations.
Notes: The table reports the percent of the population with wealth holdings in housing and the stock
market (including stocks held indirectly in 401(k)-type retirement accounts). Results are weighted to be
nationally representative.
Table 2
Housing Wealth Concentration by Income Quintile
Income
quintile Year
2001
2004
2007
2010
1
2
3
4
5
65.0
73.3
69.9
71.0
41.9
51.3
49.4
48.3
32.7
37.7
41.7
37.6
22.3
28.3
27.3
26.3
11.4
11.1
11.4
13.6
Source: Survey of Consumer Finances and authors’ calculations.
Notes: The table reports the median share of housing wealth as a percent of total wealth according to the
Survey of Consumer Finances. “1” represents the lowest quintile of the household income distribution in
a given year and “5” represents the highest quintile.
the most likely to hold stocks, the data are viewed as being particularly
accurate for these types of comparisons. In addition, the share of housing
wealth in total wealth is much higher for lower-income homeowners than
for higher-income homeowners, as shown in Table 2. Because lower-income
households are more likely to be credit-constrained and myopic than
higher-income households, the higher housing wealth concentration in the
lower parts of the income distribution should tend to make the aggregate
marginal propensity to consume out of housing wealth higher than the
marginal propensity to consume out of financial wealth.
Taken together, these various considerations suggest that the housing
wealth effect could be larger or smaller than the effect associated with
financial wealth. As a result, the differential impact is largely an empirical
question. Although this question has received much attention within the
wealth effects literature during and after the recent housing boom and bust,
consensus has yet to be reached.
Household Wealth Effects and the US Macroeconomy
9
Case, Quigley, and Shiller (2005) found relatively large housing wealth
effects and relatively small financial wealth effects using state-level panel
data. Bostic, Gabriel, and Painter (2009) found similar results using
household-level data, and, based on the credit-record evidence on the
amount of housing capital gains that were liquefied during the housing
boom, Mian and Sufi (2011) also concluded that housing wealth effects are
very large. In contrast, Cooper (2013) finds slightly larger financial wealth
effects than housing wealth effects after paying particular attention to the
borrowing collateral role of housing wealth. De Bonis and Silvestrini (2012)
also found larger financial asset effects than real (housing) wealth effects on
consumption, using a panel of OECD countries.
The empirical results regarding the relative sizes of the financial wealth and
housing wealth effects are thus mixed. These differences matter for thinking
about the interaction between wealth and the macroeconomy, because the
vast majority of forecast models follow Thaler’s (1990) assumption that assets
are fungible and money is money. More empirical work is therefore needed to
determine whether assets are not fungible, and, if so, what is the mechanism
causing one to matter more than another.
If households indeed have different propensities to consume out of one
type of wealth than another, accurate forecasting of US macroeconomic
growth will require taking account of differential movements in the components of wealth. Conventional consumption models typically include
total wealth rather than its pieces. This means that the coefficient on wealth
reflects the average experience over time, which will, in turn, reflect the
average historical “driver” of aggregate wealth movements that may be
higher or lower than the propensity to consume out of a given component
of wealth.
THE UNDERPINNINGS OF STOCK MARKET WEALTH EFFECTS
Although stocks do not provide consumption services like housing, other
complications present themselves when thinking about the mechanism
behind stock market wealth effects. First, rising stock prices require individuals who do not own stocks but intend to do so in the future (e.g., younger
households with plans to begin saving for retirement) to purchase them at a
higher price. Second, some recent evidence suggests that individuals might
respond anomalously to stock market gains realized in defined-contribution
pension accounts because of behavioral considerations. In particular, Choi,
Laibson, Madrian, and Metrick (2009) find that individuals tend to raise
their retirement plan contributions after experiencing good returns; if these
higher contributions are funded by reduced consumption, one would see a
wealth effect in the opposite direction of what standard theory predicts.
10
EMERGING TRENDS IN THE SOCIAL AND BEHAVIORAL SCIENCES
In the data, there is a strong positive relationship between aggregate consumption and aggregate stock prices. But, given the considerations above,
some analysts have argued that this relationship may not stem from the direct
effect of consumption on wealth but rather from a signaling channel. In particular, because stock prices tend to rise and fall with optimism about the
economy, it may be the case that consumption is responding primarily to
revisions to households’ expectations about future wage growth and not necessarily to stock price fluctuations.
The standard empirical approach for investigating the impact of stock price
fluctuations on consumption is to examine whether stockholders have a different response to stock price increases than nonstockholders. A more pronounced consumption effect for stockholders than nonstockholders is consistent with stock prices having a direct impact on consumption. Poterba and
Samwick (1995) find stockholders’ food consumption reacts more strongly to
stock market movements than that of nonstockholders, and Dynan and Maki
(2001) find similar results for a broader measure of consumption. Maki and
Palumbo (2001) examine data on saving and capital gains and find that the
largest declines in saving (and therefore the biggest increases in consumption) occurred for the groups most likely to hold stocks.
Much less work has been done on the stock market wealth effect question
over the past decade, presumably because the focus of the empirical wealth
effects literature has shifted to the housing area. However, Dynan (2010) finds
preliminary evidence that incorporating more recent household-level data
into the analyses of the differential behavior of stockholders and nonstockholders considerably weakens earlier results. Given that the dramatic swings
in stock prices since the late 1990s offer much more opportunity to identify
the underpinnings of stock market wealth effect, more research should revisit
the earlier findings.
WEALTH EFFECTS AND HOUSEHOLD DEBT
Wealth effects are typically viewed as stemming from movements in the
prices of assets such as stocks and homes. However, a household’s net
worth is also a function of the debt that it holds. The sluggish performance
of the US economy in recent years—in combination with the high levels of
household debt and leverage among US households that emerged from the
mortgage boom and bust—have drawn attention to the issue of whether
household debt levels held back consumption during the economic recovery.
If debt matters for fluctuations in household spending, macroeconomists
should take account of debt-related developments in addition to looking at
the movements in the overall household wealth.
Household Wealth Effects and the US Macroeconomy
11
The theoretical case for debt holding down consumption is not completely
clear, as the traditional models used by macroeconomists suggest that
debt does not exert an independent influence on consumption beyond
debt-related movements in household net worth. A case can be made,
however, for why household debt matters for consumption beyond net
worth for several reasons. First, some households may target a given level of
debt relative to their income or assets; if the events of recent years increased
these ratios (or lowered households’ target ratios), one might expect these
households to choose to pare back their consumption in order to pay
down debt. Second, high-debt households may have become more worried
about future credit availability, leading them to cut their consumption so
as to increase their savings. Third, households whose current income is
lower than their permanent income might have been forced to reduce their
consumption, because their high levels of debt relative to income or assets
prevented them from obtaining any further credit that they might have
needed to finance their desired spending.
Turning to the empirical literature, Cooper (2012) finds that aggregate US
consumption did not behave particularly unusually during and following
the Great Recession, given movements in household income and net worth.
Yet, in household-level data, Dynan (2012) and Cooper (2012) both find that
high debt had a negative impact on consumption growth during the Great
Recession, even after controlling for income, net worth, and other factors
likely to affect spending. As Cooper (2012) highlights, however, this relationship existed before the Great Recession, suggesting that the recent period is
not particularly unusual. Even so, debt could have had a larger impact on
consumption recently, as more households are burdened by high debt and
leverage compared with earlier periods. In addition, Dynan and Edelberg
(2013) found that high-debt households were more likely to report scaling
back their consumption in 2009, again after controlling for other drivers of
spending. Finally, as noted earlier, regional data analysis of Mian, Rao, and
Sufi (2013) concluded that leverage helped amplify the negative effect on consumption from declining house prices during the Great Recession.
The household-level empirical research on the relationship between debt
and consumption is, as yet, limited. At best, it considers only the period
through the Great Recession and does not directly speak to the weak performance of the economy during the recovery. Moreover, the standard errors
in many of these studies are large. Finally, the emphasis has been on establishing the relationship rather than discerning why a relationship exists—an
issue that is highly relevant to the discussion pertaining to what, if any, policies should be used to address the situation.
12
EMERGING TRENDS IN THE SOCIAL AND BEHAVIORAL SCIENCES
These shortcomings in the existing analysis of the relationship between
household debt and consumption suggest many promising avenues for further research. Some preliminary steps in understanding the relationship theoretically have been taken (see, e.g., Eggertsson & Krugman, 2012), but more
work is needed to realistically characterize the complex linkages found in the
actual economy.
HAS THE WEALTH EFFECT CHANGED OVER TIME?
As noted above, if the response of household spending to changes in wealth
differs by the type of wealth, then one should expect to see the strength
of the aggregate wealth effect to be different, depending on the underlying
source of a given movement in aggregate household wealth. In this section,
we discuss other reasons why the wealth effect—at both the aggregate and
individual levels—may change over time.
To begin, the size of the aggregate wealth effect may have changed because
of demographics. In principle, older households with shorter remaining
life horizons over which to spend changes in their wealth should have a
larger marginal propensity to consume out of wealth shocks than younger
households. Of course, such age differences may depend on whether
households’ consumption planning horizons actually do depend on their
expected remaining life span. If households take a dynastic view and intend
to share their wealth gains with their descendants, then their consumption
response may be more muted. But, generally, the role of households’ age in
determining their consumption response to wealth fluctuations implies that
the aging of the baby boom should tend to increase the aggregate marginal
propensity to consume out of wealth.
Financial innovation may have also changed the link between wealth and
consumption. In the decades preceding the 2008–2009 financial crisis, technological advances and institutional developments (including regulatory and
tax code changes) reduced credit constraints, increasing access and lowering
the cost of borrowing. But, the effect of these changes on the size of the wealth
effect is unclear. On the one hand, having fewer credit-constrained households might reduce the aggregate wealth effect, because, as discussed above,
the empirical evidence suggests that credit constraints tend to be associated
with a stronger wealth effect. On the other hand, financial innovation made it
easier and cheaper to liquefy housing wealth through home equity loans and
cash-out refinancing transactions, such that constrained households could
borrow more easily against housing capital gains. By itself, this trend should
have tended to increase the aggregate wealth effect. Of course, in recent years,
credit availability has swung in the other direction, undoing some, though
not all, of these changes.
Household Wealth Effects and the US Macroeconomy
13
On the asset side of the balance sheet, financial innovation has allowed
more households to own stocks through vehicles such as mutual funds and
401(k)-like accounts. Although the ownership rate has been around 50%
since 2000 (Table 1), it was only a little more than 30% in the late 1980s
(Dynan, 2009). As a result, more stock is held by lower-income households
that likely have higher marginal propensities to consume. All else equal, this
should have increased the aggregate wealth effect, although the effect could
be muted or even go the other way if households view their retirement
accounts as “off limits” for consumption. Household spending could also
fall, as discussed above, in the face of capital gains if households are “chasing
returns.”
All told, many factors might have changed the aggregate wealth effect over
time. Assessing the direction in which it has changed is difficult using aggregate data because of the small sample sizes. For example, recent research
by analysts at Credit Suisse (2013) showed that the estimated wealth effects
for both housing and financial wealth were smaller when postfinancial crisis data were used in the analysis, but the limited variation seen since the
crisis (home prices were roughly flat and the stock market mostly trended
upward) means that the authors could not effectively estimate separate coefficients for the different time periods. However, researchers should be able to
draw inferences on how the coefficients might have changed in response to
these developments using household-level or regional data, where the price
variation is much richer.
DATA CHALLENGES
As has been discussed throughout this essay, US macroeconomic data are not
very useful for establishing the empirical relationship between wealth and
consumption. The variation is limited, which hinders identification, particularly when relationships are changing over time and the determinants of
consumption are interrelated.
Household-level datasets tend to be much richer in scope and have many
data points, such that there is much more opportunity for identification. Yet,
these data also have shortcomings. First, most household datasets do not
have all of the elements needed for estimating consumption functions—a
panel dimension, complete balance sheet information, broad measures of
consumption, good income measures, and demographic information (which
can proxy for preferences, risk of job loss, access to credit, and other things).
Even when such information is available (as in the cases of the US Panel
Study on Income Dynamics and the US Health and Retirement Survey), the
data tend to be noisy because of recall error and other measurement problems, leading to imprecise estimates of key relationships. Household-level
14
EMERGING TRENDS IN THE SOCIAL AND BEHAVIORAL SCIENCES
data are also not without identification issues, but these issues can be circumvented by, for instance, looking at the effects across different groups of
households. (See Cooper, 2013, for more details).
Recently, researchers have turned to administrative records, such as data
from credit bureaus or financial services companies. These datasets tend to
be quite detailed and accurate in terms of the data the companies track and
record, but they lack direct measures of household consumption, income, and
total wealth. Researchers such as Mian, Rao, and Sufi (2013) have aggregated
these types of administrative records to the regional level and then combined
them with regional information related to consumption, income, and wealth
in order to do more complete analyses. This approach shows promise and
should be explored more fully. However, identification with regional data
may always be impaired, because the set of covariates is simply not as rich
as it would be in household survey data. For example, there is no data source
in the United States that would offer complete information about wealth by
region. An ideal solution might be to merge the less noisy administrative data
into household surveys, based on available overlapping variables, in order
to have the best of all worlds.
CONCLUSION
To date, there has been much interesting research on and debate surrounding the influence of wealth shocks on macroeconomic dynamics. Much is
yet to be learned in this area. Understanding wealth effects is critical not
only for forecasting consumption and broader economic growth well, but
also for gauging the risks to the economic outlook and setting appropriate
macroeconomic policy. Such issues are particularly important during periods
of substantial asset price fluctuations.
We have identified a need to learn more about the underpinnings of wealth
effects in the United States and how the effects might differ for different
components of household wealth, including the liabilities side of the balance
sheet. Relatedly, more work is needed to understand how aggregate wealth
effects may have changed (and still be changing) over time. The research has
been limited to some extent by a lack of good data sources, and, accordingly,
some focus should be on ways we can improve the existing datasets and create new ones.
REFERENCES
Buiter, W. H. (2010). Housing wealth isn’t wealth. Economics. The Open-Access,
Open-Assessment E-Journal, 4, 2010–2022. http://dx.doi.org/10.5018/economicsejournal.ja.2010-22
Household Wealth Effects and the US Macroeconomy
15
Board of Governors of the Federal Reserve System (1996). Monetary policy report to
the congress (February 20).
Bostic, R., Gabriel, S., & Painter, G. (2009). Housing wealth, financial wealth and
consumption: new evidence from micro data. Regional Science and Urban Economics,
39, 79–89.
Carroll, C. D., Otsuka, M., & Slacalek, J. (2011). How large are housing and financial wealth effects? A new approach. Journal of Money, Credit, and Banking, 43(1),
55–79.
Case, K. E., Quigley, J. M., & Shiller, R. J. (2005). Comparing wealth effects: the stock
market versus the housing market. The BE Journal of Macroeconomics, 5(1).
Case, K.E., Quigley, J.M., & Shiller, R. J. (2011). Wealth effects revisited 1978–2009.
(National Bureau of Economic Research Working Paper No. w18667). Retrieved
from http://www.nber.org/papers/w16848
Case, K.E., Quigley, J. M., & Shiller, R. J. (2013). Wealth effects revisited: 1975–2012.
(National Bureau of Economic Research Working Paper No. w18667). Retrieved
from http://ssrn.com/abstract=2199737
Choi, J. J., Laibson, D., Madrian, B., & Metrick, A. (2009). Reinforcement learning and
savings behavior. Journal of Finance, 64 (December), 2515–2534.
Credit Suisse (2013). Honey I shrunk the wealth effect. (U.S. Economics Digest,
February 13, 2013). Retrieved from https://doc.research-and-analytics.csfb.com/
docView?language=ENG&format=PDF&document_id=1009835261&source_id=
emcmt&serialid=8YGZy8sRLE7s8bPAqiwckJea9Oo1BMSdc81jhgkqNFI%3d
Cooper, D. (2013). House price fluctuations: The role of housing wealth as borrowing
collateral. Review of Economics and Statistics, 95 (October), 1183–1197.
Cooper, D. (2012). U.S. household deleveraging: What the aggregate and
household-level data tell us. (Federal Reserve Bank of Boston Public Policy Brief
no. 12–2). Retrieved from http://www.bostonfed.org/economic/ppb/2012/
ppb122.htm
Davis, M. A., & Palumbo, M. G. (2001). A primer on the economics and time
series econometrics of wealth effects. (Board of Governors of the Federal
Reserve Finance and Economics Discussion Series no. 2001–09). Retrieved from
http://www.federalreserve.gov/pubs/feds/2001/200109/200109abs.html.
De Bonis, R., & Silvestrini, A. (2012). The effects of financial and real wealth on consumption: New evidence from OECD countries. Applied Financial Economics, 22,
409–425. doi:10.1080/09603107.2011.613773
Dynan, K. E. & Maki, D. (2001). Does stock market wealth matter for consumption? (Board of Governors of the Federal Reserve Finance and Economics Discussion Paper No. 2001–23). Retrieved from http://www.federalreserve.gov/pubs/
feds/2001/200123/200123pap.pdf
Dynan, K. E. (2009). Changing household financial opportunities and economic security. Journal of Economic Perspectives, 23(4), 49–68.
Dynan, K. E. (2010). Wealth effects and the changing economy. Retrieved
from http://www.brookings.edu/research/papers/2010/05/14-wealth-effectschanging-economy-dynan
16
EMERGING TRENDS IN THE SOCIAL AND BEHAVIORAL SCIENCES
Dynan, K. (2012). Is a household debt overhang holding back consumption? Brookings Papers on Economic Activity. Spring. Retrieved from http://www.brookings.
edu/∼/media/projects/bpea/spring%202012/2012a_dynan.
Dynan, K., & Edelberg, W. (2013). What’s driving deleveraging? Evidence from the
2007–2009 Survey of Consumer Finances. Unpublished manuscript.
Economic Report of the President 2013 (2013). Retrieved from http://www.white
house.gov/administration/eop/cea/economic-report-of-the-President/2013.
Eggertsson, G., & Krugman, P. (2012). Debt, deleveraging, and the liquidity trap:
A Fisher-Minsky-Koo approach. Quarterly Journal of Economics, 127(3), 1469–
1513.
Lehnert, A. (2004). Housing, consumption, and credit constraints. (Board of Governors of the Federal Reserve Finance and Economics Discussion Series no. 2004–63).
Retrieved
from
http://www.federalreserve.gov/pubs/feds/2004/200463/
200463pap.pdf
Maki, D. M. & Palumbo, M. G. (2001). Disentangling the wealth effect: a cohort
analysis of household saving in the 1990s. (Board of Governors of the Federal
Reserve Finance and Economics Discussion Series no. 2001–21). Retrieved from
http://www.federalreserve.gov/pubs/feds/2001/200121/200121abs.html.
Mian, A., & Sufi, A. (2011). House prices, home equity-based borrowing, and the U.S.
household leverage crisis. American Economic Review, 101, 2132–56.
Mian, A. R., Rao, K., & Sufi, A. (2013). Household balance sheets, consumption, and
the economic slump. (Chicago Booth Research Paper No. 13–42). Retrieved from
http://ssrn.com/abstract=1961211 or http://dx.doi.org/10.2139/ssrn.1961211
Poterba, J. M., & Samwick, A. A. (1995). Stock ownership patterns, stock market fluctuations, and consumption. Brookings Papers on Economic Activity, 26(2), 295–372.
Thaler, R. H. (1990). Saving, Fungibility, and Mental Accounts. Journal of Economic
Perspectives, 4(1), 193–205.
KAREN DYNAN SHORT BIOGRAPHY
Karen Dynan is an expert on macroeconomic policy and household finance
issues. From 2009 to 2013, she was vice president, co-director of Economic
Studies, and the Robert S. Kerr Senior Fellow at the Brookings Institution.
Before joining Brookings, Dynan served on the staff of the Federal Reserve
Board for 17 years, most recently as a senior adviser. She also served as
a senior economist at the White House Council of Economic Advisers,
from 2003 to 2004, and as a visiting assistant professor at Johns Hopkins
University in 1998. Dynan’s research focuses on consumer spending and
saving decisions, household debt and deleveraging, household financial
security, foreclosure prevention, and the effects of financial innovation on
economic dynamics. Her papers have been published in top economics
journals, including the American Economic Review, Journal of Political Economy,
Journal of Economic Perspectives, and Journal of Monetary Economics. Dynan
Household Wealth Effects and the US Macroeconomy
17
received her PhD in Economics from Harvard University and her AB from
Brown University.
DANIEL COOPER SHORT BIOGRAPHY
Daniel Cooper is a senior economist in the macroeconomics/international
economics section of the research department at the Federal Reserve Bank of
Boston. His main research interests include issues related to household consumption and consumer behavior. He has published research, examining the
borrowing collateral role of housing wealth for household consumption and
consumer behavior. Recently, his work has focused on the economic impact of
household balance sheet changes, including debt repayment, issues related
to household mobility, and income inequality. Currently, he is working on
projects related to the effect of housing price changes on various individual
and household-level outcomes, including access to education. Cooper holds
a BA in economics from Amherst College. He earned MA and PhD degrees
in Economics from the University of Michigan.
RELATED ESSAYS
Models of Revealed Preference (Economics), Abi Adams and Ian Crawford
Misinformation and How to Correct It (Psychology), John Cook et al.
Financialization of the US Economy (Sociology), Gerald (Jerry) F. Davis and
Suntae Kim
Changing Family Patterns (Sociology), Kathleen Gerson and Stacy Torres
Economics and Culture (Economics), Gérard Roland
The Future of Employment, Wages, and Technological Change (Economics),
Michael J. Handel
Behavioral Economics (Sociology), Guy Hochman and Dan Ariely
Family Formation in Times of Labor Market Insecurities (Sociology), Johannes
Huinink
Emotion and Decision Making (Psychology), Jeff R. Huntsinger and Cara Ray
Cultural Neuroscience: Connecting Culture, Brain, and Genes (Psychology),
Shinobu Kitayama and Sarah Huff
Maternal and Paternal Employment across the Life Course (Sociology),
Michaela Kreyenfeld
Household Economy (Sociology), Laura Lein and Amanda Tillotson
From Individual Rationality to Socially Embedded Self-Regulation (Sociology), Siegwart Lindenberg
Against Game Theory (Political Science), Gale M. Lucas et al.
The Future of Marriage (Sociology), Elizabeth Aura McClintock
Family Income Composition (Economics), Kristin E. Smith
Transnational Work Careers (Sociology), Roland Verwiebe
-
Household Wealth Effects
and the US Macroeconomy
KAREN DYNAN and DANIEL COOPER
Abstract
The effect of wealth on consumption is an issue of long-standing interest to
economists. Analysts believe that fluctuations in household wealth have driven
major swings in economic activity. This essay considers the so-called “wealth
effects”—the impact of changes in wealth on household consumption and the
overall macroeconomy. There is an extensive existing literature on wealth effects,
but there are also many unanswered issues and questions. This essay reviews the
important issues regarding the role wealth plays in the macroeconomy and argues
that there is a need for much more wealth effect research as well as better data
sources for conducting such analysis.
The effect of wealth on consumption is an issue of long-standing interest to economists. The relationship has been particularly important from a
policy perspective since the mid-1990s, as the US economy has since experienced two major booms and busts in stock prices, as well as a dramatic
run-up and reversal of home prices. Analysts believe that the resulting fluctuations in household wealth have driven major swings in the US economic
activity. Indeed, the plunge in household wealth during the financial crisis is
frequently cited as contributing importantly to the unusually slow recovery
of the US economy from the Great Recession.
Against this backdrop, it is perhaps not surprising that a great deal of
empirical research over the last 25 years has focused on the so-called “wealth
effects”—the impact of changes in wealth on household consumption and
the overall macroeconomy. Such studies have used different types of data to
examine the relationship between wealth and household spending, including macroeconomic time series, regional data, household survey results, and
credit bureau records. Despite this attention from the research community,
many important questions about wealth effects remain unanswered. We
Emerging Trends in the Social and Behavioral Sciences. Edited by Robert Scott and Stephen Kosslyn.
© 2015 John Wiley & Sons, Inc. ISBN 978-1-118-90077-2.
1
2
EMERGING TRENDS IN THE SOCIAL AND BEHAVIORAL SCIENCES
review these questions, arguing that there is a pressing need for more
research in the area as well as a need to develop better data sources for such
research.
BACKGROUND
The swings in the US household wealth over the last two decades began with
a run-up in stock prices in the late 1990s, as shown in Figure 1, driven in
large part by optimism over the potential for new technologies to raise the
productivity of US businesses. Market confidence collapsed in early 2000,
and stock prices subsequently retreated as the US economy experienced a
mild recession. By mid-2003, though, employment conditions began to show
decided improvements amid robust economic growth, and the United States
thereafter saw several years of rapidly rising stock and home prices.
Unfortunately, the prosperity proved to be transitory. Home prices, which
had risen well above the levels justified by fundamentals, began to edge
down in 2006 and were sharply declining by the following year. Delinquency
rates on mortgages rose, starting with the so-called “affordable” mortgages,
many of which were fundamentally unsustainable in the absence of continued home price appreciation, leading to a tightening of credit conditions,
further investor losses, and, ultimately, the most severe financial crisis and
economic downturn in the United States since the Great Depression. By
early 2009, the value of stocks held by households was down roughly 50%
200
150
100
50
0
1990q1
Case–Shiller index
1500
1000
500
S&P 500 index
2000
Stock and house prices
1995q1
2000q1
S&P 500
2005q1
2010q1
2015q1
Case–Shiller index
Figure 1 Stock prices and house prices. Source: Standard and Poor’s, Wall
Street Journal/ Haver Analytics.
Household Wealth Effects and the US Macroeconomy
3
5.5
4.5
5
Ratio
6
6.5
Net worth to income
1980q1 1985q1 1990q1 1995q1 2000q1 2005q1 2010q1 2015q1
Figure 2 Net worth-to-income ratio. Source: Federal Reserve Board, BEA/Haver
Analytics.
from its peak, and the value of real estate owned by households was down
roughly 25%.
The evolution of US household wealth clearly shows the imprint of these
dramatic movements in asset prices, as shown in Figure 2. The stock price
bubble of the late 1990s propelled the aggregate ratio of household wealth to
disposable personal income from less than 5 to 6.2 at its peak around 2000.
After taking back most of these gains in the early 2000s, the ratio shot up
again during the housing boom, reaching 6.5 in 2006 before tumbling to its
lowest level in about 15 years. The recovery in stock prices since their low
point in early 2009 has brought the ratio of household wealth-to-income back
up to a level roughly comparable to 1997.
According to conventional wisdom, these swings in household wealth
have been important drivers of economic activity in the United States, and
policy-related discussions often reference the relationship. For example, in
its February 1996 Monetary Policy Report to Congress, the Federal Reserve
noted, “In the household sector, the accumulation of financial wealth
brought on by the rise in the stock market has provided the wherewithal
for increases in consumption greater than would otherwise have been
expected—countering the potential negative influences of more burdensome levels of consumer debt.” In a 2002 speech, then Federal Reserve
Governor Edward Gramlich remarked, “. . .the link between aggregate
household wealth and spending has remained one of the sturdier empirical
relationships in macroeconomics.” The 2013 Economic Report of the President
stated, “A total of $16 trillion in wealth was erased by the financial and
4
EMERGING TRENDS IN THE SOCIAL AND BEHAVIORAL SCIENCES
housing crisis, causing families to pull back on spending plans, reduce
personal debt and increase savings, in turn leading companies to cut back
hiring, lay off valued employees, and halt investment plans.”
ESTIMATING WEALTH EFFECTS USING MACRO DATA: BASIC
RESULTS AND LIMITATIONS
Standard economic theory (the Permanent Income Hypothesis) offers a
framework for thinking about wealth effects. In particular, households
should consume a constant fraction of their (appropriately calculated)
lifetime resources. Changes in wealth that permanently alter the households’ lifetime resources therefore should cause consumption to change.
This posited relationship is consistent with the strong positive correlation
seen when the aggregate “consumption rate” (consumption as a share
of disposable personal income) is plotted against the ratio of aggregate
household wealth to disposable personal income (Figure 3).
More formal modeling of the relationship between aggregate consumption
and aggregate household wealth has produced estimates of the timing and
magnitude of the wealth effect. Davis and Palumbo (2001) present an analysis
based on typical consumption forecasting models and conclude that consumer spending rises by between 3 and 6 cents for every additional dollar
of wealth, with the effect occurring gradually over a period of several years
(see also Carroll, Otsuka, & Slacalek, 2011).
4
2
0
–2
4-quarter percent change
10
0
–10
–20
4-quarter percent change
6
20
Changes in net worth and consumption
1980q1 1985q1 1990q1 1995q1 2000q1 2005q1 2010q1 2015q1
Net worth
Real consumption
Figure 3 Consumption and net worth. Source: Federal Reserve Board, BEA/
Haver Analytics.
Household Wealth Effects and the US Macroeconomy
5
While macroeconometric models provide useful guidance on the average
historical relationship between aggregate consumption and wealth, they also
have limitations. In particular, the degree to which the models are useful for
forecasting aggregate consumption dynamics or uncovering key economic
relationships depends on the degree to which household behavior is homogeneous as well as the degree to which changes to the economic environment
are distributed evenly and consistently over time. In practice, these conditions are not met: the actual economy is characterized by heterogeneity that
is not consistent over time.
In the existing wealth effects literature, much attention has focused on
credit constraints as a potential source of heterogeneity in how different
households respond to changes in wealth. In particular, households that
are consuming at a suboptimal level because they cannot borrow as much
as they desire should have a particularly powerful consumption response
to wealth gains (at least to the extent that those gains can be liquefied).
Indeed, Lehnert (2004) estimated higher propensities to consume out of
housing wealth for younger US households than their older counterparts,
arguing that the former group was the most likely to be constrained. Bostic,
Gabriel, and Painter (2009) also find that borrowing constraints impact
the relationship between wealth and consumption. In a somewhat more
recent work, Cooper (2013) used several alternative approaches to show
that borrowing constraints heighten the relationship between consumption
and housing wealth in US household-level data. Finally, using spending
and balance sheet data at the regional level, Mian, Rao, and Sufi (2013) find
substantially higher propensities to consume for poorer and more levered
households—again, the groups most likely to be constrained. Although the
precise results differ from essay to essay, the findings in these studies are
strongly consistent with the view that housing wealth effects are larger for
households that are more likely to be facing borrowing constraints (see also
Case, Quigley, & Shiller, 2005, 2011, 2013).
The geographic dispersion of the housing wealth movements over the last
decade represents another possible source of heterogeneity in wealth effects.
Figure 4 shows the wide dispersion of home price appreciation across states
from 2002 to 2006. For the most part, the subsequent housing bust was similarly concentrated. This distribution should be relevant for the strength of
the aggregate wealth effect, given that different states have different demographic characteristics, which should affect the response of consumption to
wealth (e.g., one might expect a stronger effect in states where people are in
demographic groups more likely to be borrowing constrained).
These types of heterogeneity do not in and of themselves invalidate analyses of wealth effects based on macroeconomic models. If aggregate wealth
changes always had the same distribution across people and space, then the
6
EMERGING TRENDS IN THE SOCIAL AND BEHAVIORAL SCIENCES
0–20%
20–40%
40–60%
>60%
Figure 4 House price changes by state (2002–2006). Source: FHFA/Haver
Analytics.
estimated coefficients from the models—which essentially reflect the average historical relationship between wealth and consumption—would well
capture the expected response to a new change in wealth. But, in fact, the distribution of aggregate wealth changes across different types of people is not
consistent over time, varying because of differences in the types of wealth
held and also because the fraction of people having a certain trait (such as
being borrowing constrained) can change. The spatial dispersion of wealth
shocks also varies over time. For example, real house prices surged 39% in the
Boston Metropolitan Statistical Area (MSA) between 1984 and 1986 as part of
a coastal housing boom at that time. In comparison, real house price appreciation was only about 8.5% in the Chicago MSA and 4.3% in the Kansas City
MSA over this period.
KEY UNRESOLVED ISSUES REGARDING WEALTH EFFECTS
The previous discussion of the limitations of the standard approach to modeling wealth effects highlights the need to know much more about the underpinnings of wealth effects at the household level. In this section, we discuss
the outstanding questions that are most important from a policy perspective,
reviewing where the literature currently stands and where more research
would be helpful.
IS HOUSING WEALTH REALLY WEALTH?
The recent boom and bust in US home prices has spurred interest in how
housing wealth influences the macroeconomy, and, in particular, whether
housing wealth has the same effect on households’ spending decisions as
Household Wealth Effects and the US Macroeconomy
7
financial wealth. To this point, Buiter (2010) argues that housing wealth is not
really wealth. The underlying intuition is that housing wealth differs from
other household (financial) wealth, because it serves both as an asset and as
a consumption good. As a result, when home prices rise, the ownership (or
rental) costs of housing also increase.
Renters are unambiguously worse off when the cost of housing consumption increases, because, for a given amount of income, they must reduce
their consumption of nonhousing goods in order to offset the higher cost of
their shelter. The impact of home appreciation on homeowners is less clear,
as higher housing costs require homeowners to decrease their nonhousing
consumption for a given amount of income, but they receive an offsetting
capital gain from the higher home prices. If housing costs do not increase
one-for-one with home price appreciation, then homeowners could be better
off when house prices rise. Typically, though, economists think that housing
costs and house prices move together; so, homeowners’ actual wealth gains
from house price appreciation may be small or nonexistent. Moreover,
homeowners may have to reoptimize and downsize their housing stock in
order to fully realize their gains for consumption purposes—something that
many owners may not be willing to do, given transaction costs and other
factors, especially in the short-term.
Housing wealth may, however, impact consumption indirectly through its
role as borrowing collateral. When home prices rise, the value of homeowners’ collateral increases, and they can borrow against their additional home
equity such that they can spend more on goods and services (including
home improvements) and meet other financial needs. Previously constrained
homeowners are therefore likely to increase their spending when house
prices rise. In the data, this borrowing collateral effect should show up as a
positive relationship between housing wealth and consumption.
Further, as Case, Quigley, and Shiller (2013) argue, homeowners may
increase their consumption in response to housing appreciation for psychological reasons. That is, they may respond to societal perceptions that
housing gains make them better off or they may be myopic and fail to
consider that if everyone in their area experiences similar housing gains
they are not necessarily any better off.
At the aggregate level, we might also expect to see changes in housing
wealth have a different effect on consumption than changes in financial
wealth because of its different distribution across households. Table 1
shows that roughly two-thirds of households own homes, while only
about half hold stocks (including stocks held indirectly through mutual
funds, defined-contribution retirement plans, and the like). The data come
from the Survey of Consumer Finances (SCF), weighted to be nationally
representative. Because the SCF oversamples wealthy households who are
8
EMERGING TRENDS IN THE SOCIAL AND BEHAVIORAL SCIENCES
Table 1
Ownership Rates by the Type of Asset
Year
Housing
Stocks
2001
2004
2007
2010
66.9
68.4
67.9
64.6
52.3
50.3
53.2
49.9
Source: Survey of Consumer Finances and authors’ calculations.
Notes: The table reports the percent of the population with wealth holdings in housing and the stock
market (including stocks held indirectly in 401(k)-type retirement accounts). Results are weighted to be
nationally representative.
Table 2
Housing Wealth Concentration by Income Quintile
Income
quintile Year
2001
2004
2007
2010
1
2
3
4
5
65.0
73.3
69.9
71.0
41.9
51.3
49.4
48.3
32.7
37.7
41.7
37.6
22.3
28.3
27.3
26.3
11.4
11.1
11.4
13.6
Source: Survey of Consumer Finances and authors’ calculations.
Notes: The table reports the median share of housing wealth as a percent of total wealth according to the
Survey of Consumer Finances. “1” represents the lowest quintile of the household income distribution in
a given year and “5” represents the highest quintile.
the most likely to hold stocks, the data are viewed as being particularly
accurate for these types of comparisons. In addition, the share of housing
wealth in total wealth is much higher for lower-income homeowners than
for higher-income homeowners, as shown in Table 2. Because lower-income
households are more likely to be credit-constrained and myopic than
higher-income households, the higher housing wealth concentration in the
lower parts of the income distribution should tend to make the aggregate
marginal propensity to consume out of housing wealth higher than the
marginal propensity to consume out of financial wealth.
Taken together, these various considerations suggest that the housing
wealth effect could be larger or smaller than the effect associated with
financial wealth. As a result, the differential impact is largely an empirical
question. Although this question has received much attention within the
wealth effects literature during and after the recent housing boom and bust,
consensus has yet to be reached.
Household Wealth Effects and the US Macroeconomy
9
Case, Quigley, and Shiller (2005) found relatively large housing wealth
effects and relatively small financial wealth effects using state-level panel
data. Bostic, Gabriel, and Painter (2009) found similar results using
household-level data, and, based on the credit-record evidence on the
amount of housing capital gains that were liquefied during the housing
boom, Mian and Sufi (2011) also concluded that housing wealth effects are
very large. In contrast, Cooper (2013) finds slightly larger financial wealth
effects than housing wealth effects after paying particular attention to the
borrowing collateral role of housing wealth. De Bonis and Silvestrini (2012)
also found larger financial asset effects than real (housing) wealth effects on
consumption, using a panel of OECD countries.
The empirical results regarding the relative sizes of the financial wealth and
housing wealth effects are thus mixed. These differences matter for thinking
about the interaction between wealth and the macroeconomy, because the
vast majority of forecast models follow Thaler’s (1990) assumption that assets
are fungible and money is money. More empirical work is therefore needed to
determine whether assets are not fungible, and, if so, what is the mechanism
causing one to matter more than another.
If households indeed have different propensities to consume out of one
type of wealth than another, accurate forecasting of US macroeconomic
growth will require taking account of differential movements in the components of wealth. Conventional consumption models typically include
total wealth rather than its pieces. This means that the coefficient on wealth
reflects the average experience over time, which will, in turn, reflect the
average historical “driver” of aggregate wealth movements that may be
higher or lower than the propensity to consume out of a given component
of wealth.
THE UNDERPINNINGS OF STOCK MARKET WEALTH EFFECTS
Although stocks do not provide consumption services like housing, other
complications present themselves when thinking about the mechanism
behind stock market wealth effects. First, rising stock prices require individuals who do not own stocks but intend to do so in the future (e.g., younger
households with plans to begin saving for retirement) to purchase them at a
higher price. Second, some recent evidence suggests that individuals might
respond anomalously to stock market gains realized in defined-contribution
pension accounts because of behavioral considerations. In particular, Choi,
Laibson, Madrian, and Metrick (2009) find that individuals tend to raise
their retirement plan contributions after experiencing good returns; if these
higher contributions are funded by reduced consumption, one would see a
wealth effect in the opposite direction of what standard theory predicts.
10
EMERGING TRENDS IN THE SOCIAL AND BEHAVIORAL SCIENCES
In the data, there is a strong positive relationship between aggregate consumption and aggregate stock prices. But, given the considerations above,
some analysts have argued that this relationship may not stem from the direct
effect of consumption on wealth but rather from a signaling channel. In particular, because stock prices tend to rise and fall with optimism about the
economy, it may be the case that consumption is responding primarily to
revisions to households’ expectations about future wage growth and not necessarily to stock price fluctuations.
The standard empirical approach for investigating the impact of stock price
fluctuations on consumption is to examine whether stockholders have a different response to stock price increases than nonstockholders. A more pronounced consumption effect for stockholders than nonstockholders is consistent with stock prices having a direct impact on consumption. Poterba and
Samwick (1995) find stockholders’ food consumption reacts more strongly to
stock market movements than that of nonstockholders, and Dynan and Maki
(2001) find similar results for a broader measure of consumption. Maki and
Palumbo (2001) examine data on saving and capital gains and find that the
largest declines in saving (and therefore the biggest increases in consumption) occurred for the groups most likely to hold stocks.
Much less work has been done on the stock market wealth effect question
over the past decade, presumably because the focus of the empirical wealth
effects literature has shifted to the housing area. However, Dynan (2010) finds
preliminary evidence that incorporating more recent household-level data
into the analyses of the differential behavior of stockholders and nonstockholders considerably weakens earlier results. Given that the dramatic swings
in stock prices since the late 1990s offer much more opportunity to identify
the underpinnings of stock market wealth effect, more research should revisit
the earlier findings.
WEALTH EFFECTS AND HOUSEHOLD DEBT
Wealth effects are typically viewed as stemming from movements in the
prices of assets such as stocks and homes. However, a household’s net
worth is also a function of the debt that it holds. The sluggish performance
of the US economy in recent years—in combination with the high levels of
household debt and leverage among US households that emerged from the
mortgage boom and bust—have drawn attention to the issue of whether
household debt levels held back consumption during the economic recovery.
If debt matters for fluctuations in household spending, macroeconomists
should take account of debt-related developments in addition to looking at
the movements in the overall household wealth.
Household Wealth Effects and the US Macroeconomy
11
The theoretical case for debt holding down consumption is not completely
clear, as the traditional models used by macroeconomists suggest that
debt does not exert an independent influence on consumption beyond
debt-related movements in household net worth. A case can be made,
however, for why household debt matters for consumption beyond net
worth for several reasons. First, some households may target a given level of
debt relative to their income or assets; if the events of recent years increased
these ratios (or lowered households’ target ratios), one might expect these
households to choose to pare back their consumption in order to pay
down debt. Second, high-debt households may have become more worried
about future credit availability, leading them to cut their consumption so
as to increase their savings. Third, households whose current income is
lower than their permanent income might have been forced to reduce their
consumption, because their high levels of debt relative to income or assets
prevented them from obtaining any further credit that they might have
needed to finance their desired spending.
Turning to the empirical literature, Cooper (2012) finds that aggregate US
consumption did not behave particularly unusually during and following
the Great Recession, given movements in household income and net worth.
Yet, in household-level data, Dynan (2012) and Cooper (2012) both find that
high debt had a negative impact on consumption growth during the Great
Recession, even after controlling for income, net worth, and other factors
likely to affect spending. As Cooper (2012) highlights, however, this relationship existed before the Great Recession, suggesting that the recent period is
not particularly unusual. Even so, debt could have had a larger impact on
consumption recently, as more households are burdened by high debt and
leverage compared with earlier periods. In addition, Dynan and Edelberg
(2013) found that high-debt households were more likely to report scaling
back their consumption in 2009, again after controlling for other drivers of
spending. Finally, as noted earlier, regional data analysis of Mian, Rao, and
Sufi (2013) concluded that leverage helped amplify the negative effect on consumption from declining house prices during the Great Recession.
The household-level empirical research on the relationship between debt
and consumption is, as yet, limited. At best, it considers only the period
through the Great Recession and does not directly speak to the weak performance of the economy during the recovery. Moreover, the standard errors
in many of these studies are large. Finally, the emphasis has been on establishing the relationship rather than discerning why a relationship exists—an
issue that is highly relevant to the discussion pertaining to what, if any, policies should be used to address the situation.
12
EMERGING TRENDS IN THE SOCIAL AND BEHAVIORAL SCIENCES
These shortcomings in the existing analysis of the relationship between
household debt and consumption suggest many promising avenues for further research. Some preliminary steps in understanding the relationship theoretically have been taken (see, e.g., Eggertsson & Krugman, 2012), but more
work is needed to realistically characterize the complex linkages found in the
actual economy.
HAS THE WEALTH EFFECT CHANGED OVER TIME?
As noted above, if the response of household spending to changes in wealth
differs by the type of wealth, then one should expect to see the strength
of the aggregate wealth effect to be different, depending on the underlying
source of a given movement in aggregate household wealth. In this section,
we discuss other reasons why the wealth effect—at both the aggregate and
individual levels—may change over time.
To begin, the size of the aggregate wealth effect may have changed because
of demographics. In principle, older households with shorter remaining
life horizons over which to spend changes in their wealth should have a
larger marginal propensity to consume out of wealth shocks than younger
households. Of course, such age differences may depend on whether
households’ consumption planning horizons actually do depend on their
expected remaining life span. If households take a dynastic view and intend
to share their wealth gains with their descendants, then their consumption
response may be more muted. But, generally, the role of households’ age in
determining their consumption response to wealth fluctuations implies that
the aging of the baby boom should tend to increase the aggregate marginal
propensity to consume out of wealth.
Financial innovation may have also changed the link between wealth and
consumption. In the decades preceding the 2008–2009 financial crisis, technological advances and institutional developments (including regulatory and
tax code changes) reduced credit constraints, increasing access and lowering
the cost of borrowing. But, the effect of these changes on the size of the wealth
effect is unclear. On the one hand, having fewer credit-constrained households might reduce the aggregate wealth effect, because, as discussed above,
the empirical evidence suggests that credit constraints tend to be associated
with a stronger wealth effect. On the other hand, financial innovation made it
easier and cheaper to liquefy housing wealth through home equity loans and
cash-out refinancing transactions, such that constrained households could
borrow more easily against housing capital gains. By itself, this trend should
have tended to increase the aggregate wealth effect. Of course, in recent years,
credit availability has swung in the other direction, undoing some, though
not all, of these changes.
Household Wealth Effects and the US Macroeconomy
13
On the asset side of the balance sheet, financial innovation has allowed
more households to own stocks through vehicles such as mutual funds and
401(k)-like accounts. Although the ownership rate has been around 50%
since 2000 (Table 1), it was only a little more than 30% in the late 1980s
(Dynan, 2009). As a result, more stock is held by lower-income households
that likely have higher marginal propensities to consume. All else equal, this
should have increased the aggregate wealth effect, although the effect could
be muted or even go the other way if households view their retirement
accounts as “off limits” for consumption. Household spending could also
fall, as discussed above, in the face of capital gains if households are “chasing
returns.”
All told, many factors might have changed the aggregate wealth effect over
time. Assessing the direction in which it has changed is difficult using aggregate data because of the small sample sizes. For example, recent research
by analysts at Credit Suisse (2013) showed that the estimated wealth effects
for both housing and financial wealth were smaller when postfinancial crisis data were used in the analysis, but the limited variation seen since the
crisis (home prices were roughly flat and the stock market mostly trended
upward) means that the authors could not effectively estimate separate coefficients for the different time periods. However, researchers should be able to
draw inferences on how the coefficients might have changed in response to
these developments using household-level or regional data, where the price
variation is much richer.
DATA CHALLENGES
As has been discussed throughout this essay, US macroeconomic data are not
very useful for establishing the empirical relationship between wealth and
consumption. The variation is limited, which hinders identification, particularly when relationships are changing over time and the determinants of
consumption are interrelated.
Household-level datasets tend to be much richer in scope and have many
data points, such that there is much more opportunity for identification. Yet,
these data also have shortcomings. First, most household datasets do not
have all of the elements needed for estimating consumption functions—a
panel dimension, complete balance sheet information, broad measures of
consumption, good income measures, and demographic information (which
can proxy for preferences, risk of job loss, access to credit, and other things).
Even when such information is available (as in the cases of the US Panel
Study on Income Dynamics and the US Health and Retirement Survey), the
data tend to be noisy because of recall error and other measurement problems, leading to imprecise estimates of key relationships. Household-level
14
EMERGING TRENDS IN THE SOCIAL AND BEHAVIORAL SCIENCES
data are also not without identification issues, but these issues can be circumvented by, for instance, looking at the effects across different groups of
households. (See Cooper, 2013, for more details).
Recently, researchers have turned to administrative records, such as data
from credit bureaus or financial services companies. These datasets tend to
be quite detailed and accurate in terms of the data the companies track and
record, but they lack direct measures of household consumption, income, and
total wealth. Researchers such as Mian, Rao, and Sufi (2013) have aggregated
these types of administrative records to the regional level and then combined
them with regional information related to consumption, income, and wealth
in order to do more complete analyses. This approach shows promise and
should be explored more fully. However, identification with regional data
may always be impaired, because the set of covariates is simply not as rich
as it would be in household survey data. For example, there is no data source
in the United States that would offer complete information about wealth by
region. An ideal solution might be to merge the less noisy administrative data
into household surveys, based on available overlapping variables, in order
to have the best of all worlds.
CONCLUSION
To date, there has been much interesting research on and debate surrounding the influence of wealth shocks on macroeconomic dynamics. Much is
yet to be learned in this area. Understanding wealth effects is critical not
only for forecasting consumption and broader economic growth well, but
also for gauging the risks to the economic outlook and setting appropriate
macroeconomic policy. Such issues are particularly important during periods
of substantial asset price fluctuations.
We have identified a need to learn more about the underpinnings of wealth
effects in the United States and how the effects might differ for different
components of household wealth, including the liabilities side of the balance
sheet. Relatedly, more work is needed to understand how aggregate wealth
effects may have changed (and still be changing) over time. The research has
been limited to some extent by a lack of good data sources, and, accordingly,
some focus should be on ways we can improve the existing datasets and create new ones.
REFERENCES
Buiter, W. H. (2010). Housing wealth isn’t wealth. Economics. The Open-Access,
Open-Assessment E-Journal, 4, 2010–2022. http://dx.doi.org/10.5018/economicsejournal.ja.2010-22
Household Wealth Effects and the US Macroeconomy
15
Board of Governors of the Federal Reserve System (1996). Monetary policy report to
the congress (February 20).
Bostic, R., Gabriel, S., & Painter, G. (2009). Housing wealth, financial wealth and
consumption: new evidence from micro data. Regional Science and Urban Economics,
39, 79–89.
Carroll, C. D., Otsuka, M., & Slacalek, J. (2011). How large are housing and financial wealth effects? A new approach. Journal of Money, Credit, and Banking, 43(1),
55–79.
Case, K. E., Quigley, J. M., & Shiller, R. J. (2005). Comparing wealth effects: the stock
market versus the housing market. The BE Journal of Macroeconomics, 5(1).
Case, K.E., Quigley, J.M., & Shiller, R. J. (2011). Wealth effects revisited 1978–2009.
(National Bureau of Economic Research Working Paper No. w18667). Retrieved
from http://www.nber.org/papers/w16848
Case, K.E., Quigley, J. M., & Shiller, R. J. (2013). Wealth effects revisited: 1975–2012.
(National Bureau of Economic Research Working Paper No. w18667). Retrieved
from http://ssrn.com/abstract=2199737
Choi, J. J., Laibson, D., Madrian, B., & Metrick, A. (2009). Reinforcement learning and
savings behavior. Journal of Finance, 64 (December), 2515–2534.
Credit Suisse (2013). Honey I shrunk the wealth effect. (U.S. Economics Digest,
February 13, 2013). Retrieved from https://doc.research-and-analytics.csfb.com/
docView?language=ENG&format=PDF&document_id=1009835261&source_id=
emcmt&serialid=8YGZy8sRLE7s8bPAqiwckJea9Oo1BMSdc81jhgkqNFI%3d
Cooper, D. (2013). House price fluctuations: The role of housing wealth as borrowing
collateral. Review of Economics and Statistics, 95 (October), 1183–1197.
Cooper, D. (2012). U.S. household deleveraging: What the aggregate and
household-level data tell us. (Federal Reserve Bank of Boston Public Policy Brief
no. 12–2). Retrieved from http://www.bostonfed.org/economic/ppb/2012/
ppb122.htm
Davis, M. A., & Palumbo, M. G. (2001). A primer on the economics and time
series econometrics of wealth effects. (Board of Governors of the Federal
Reserve Finance and Economics Discussion Series no. 2001–09). Retrieved from
http://www.federalreserve.gov/pubs/feds/2001/200109/200109abs.html.
De Bonis, R., & Silvestrini, A. (2012). The effects of financial and real wealth on consumption: New evidence from OECD countries. Applied Financial Economics, 22,
409–425. doi:10.1080/09603107.2011.613773
Dynan, K. E. & Maki, D. (2001). Does stock market wealth matter for consumption? (Board of Governors of the Federal Reserve Finance and Economics Discussion Paper No. 2001–23). Retrieved from http://www.federalreserve.gov/pubs/
feds/2001/200123/200123pap.pdf
Dynan, K. E. (2009). Changing household financial opportunities and economic security. Journal of Economic Perspectives, 23(4), 49–68.
Dynan, K. E. (2010). Wealth effects and the changing economy. Retrieved
from http://www.brookings.edu/research/papers/2010/05/14-wealth-effectschanging-economy-dynan
16
EMERGING TRENDS IN THE SOCIAL AND BEHAVIORAL SCIENCES
Dynan, K. (2012). Is a household debt overhang holding back consumption? Brookings Papers on Economic Activity. Spring. Retrieved from http://www.brookings.
edu/∼/media/projects/bpea/spring%202012/2012a_dynan.
Dynan, K., & Edelberg, W. (2013). What’s driving deleveraging? Evidence from the
2007–2009 Survey of Consumer Finances. Unpublished manuscript.
Economic Report of the President 2013 (2013). Retrieved from http://www.white
house.gov/administration/eop/cea/economic-report-of-the-President/2013.
Eggertsson, G., & Krugman, P. (2012). Debt, deleveraging, and the liquidity trap:
A Fisher-Minsky-Koo approach. Quarterly Journal of Economics, 127(3), 1469–
1513.
Lehnert, A. (2004). Housing, consumption, and credit constraints. (Board of Governors of the Federal Reserve Finance and Economics Discussion Series no. 2004–63).
Retrieved
from
http://www.federalreserve.gov/pubs/feds/2004/200463/
200463pap.pdf
Maki, D. M. & Palumbo, M. G. (2001). Disentangling the wealth effect: a cohort
analysis of household saving in the 1990s. (Board of Governors of the Federal
Reserve Finance and Economics Discussion Series no. 2001–21). Retrieved from
http://www.federalreserve.gov/pubs/feds/2001/200121/200121abs.html.
Mian, A., & Sufi, A. (2011). House prices, home equity-based borrowing, and the U.S.
household leverage crisis. American Economic Review, 101, 2132–56.
Mian, A. R., Rao, K., & Sufi, A. (2013). Household balance sheets, consumption, and
the economic slump. (Chicago Booth Research Paper No. 13–42). Retrieved from
http://ssrn.com/abstract=1961211 or http://dx.doi.org/10.2139/ssrn.1961211
Poterba, J. M., & Samwick, A. A. (1995). Stock ownership patterns, stock market fluctuations, and consumption. Brookings Papers on Economic Activity, 26(2), 295–372.
Thaler, R. H. (1990). Saving, Fungibility, and Mental Accounts. Journal of Economic
Perspectives, 4(1), 193–205.
KAREN DYNAN SHORT BIOGRAPHY
Karen Dynan is an expert on macroeconomic policy and household finance
issues. From 2009 to 2013, she was vice president, co-director of Economic
Studies, and the Robert S. Kerr Senior Fellow at the Brookings Institution.
Before joining Brookings, Dynan served on the staff of the Federal Reserve
Board for 17 years, most recently as a senior adviser. She also served as
a senior economist at the White House Council of Economic Advisers,
from 2003 to 2004, and as a visiting assistant professor at Johns Hopkins
University in 1998. Dynan’s research focuses on consumer spending and
saving decisions, household debt and deleveraging, household financial
security, foreclosure prevention, and the effects of financial innovation on
economic dynamics. Her papers have been published in top economics
journals, including the American Economic Review, Journal of Political Economy,
Journal of Economic Perspectives, and Journal of Monetary Economics. Dynan
Household Wealth Effects and the US Macroeconomy
17
received her PhD in Economics from Harvard University and her AB from
Brown University.
DANIEL COOPER SHORT BIOGRAPHY
Daniel Cooper is a senior economist in the macroeconomics/international
economics section of the research department at the Federal Reserve Bank of
Boston. His main research interests include issues related to household consumption and consumer behavior. He has published research, examining the
borrowing collateral role of housing wealth for household consumption and
consumer behavior. Recently, his work has focused on the economic impact of
household balance sheet changes, including debt repayment, issues related
to household mobility, and income inequality. Currently, he is working on
projects related to the effect of housing price changes on various individual
and household-level outcomes, including access to education. Cooper holds
a BA in economics from Amherst College. He earned MA and PhD degrees
in Economics from the University of Michigan.
RELATED ESSAYS
Models of Revealed Preference (Economics), Abi Adams and Ian Crawford
Misinformation and How to Correct It (Psychology), John Cook et al.
Financialization of the US Economy (Sociology), Gerald (Jerry) F. Davis and
Suntae Kim
Changing Family Patterns (Sociology), Kathleen Gerson and Stacy Torres
Economics and Culture (Economics), Gérard Roland
The Future of Employment, Wages, and Technological Change (Economics),
Michael J. Handel
Behavioral Economics (Sociology), Guy Hochman and Dan Ariely
Family Formation in Times of Labor Market Insecurities (Sociology), Johannes
Huinink
Emotion and Decision Making (Psychology), Jeff R. Huntsinger and Cara Ray
Cultural Neuroscience: Connecting Culture, Brain, and Genes (Psychology),
Shinobu Kitayama and Sarah Huff
Maternal and Paternal Employment across the Life Course (Sociology),
Michaela Kreyenfeld
Household Economy (Sociology), Laura Lein and Amanda Tillotson
From Individual Rationality to Socially Embedded Self-Regulation (Sociology), Siegwart Lindenberg
Against Game Theory (Political Science), Gale M. Lucas et al.
The Future of Marriage (Sociology), Elizabeth Aura McClintock
Family Income Composition (Economics), Kristin E. Smith
Transnational Work Careers (Sociology), Roland Verwiebe