Recent Demographic Trends and the Family
Media
Part of Recent Demographic Trends and the Family
- Title
- Recent Demographic Trends and the Family
- extracted text
-
Recent Demographic Trends
and the Family
LAWRENCE L. WU
Abstract
For demographers, perhaps the most stunning set of changes in the family to have
emerged over the last century are changes that drove what appeared to have been
exploding populations, both in the world at large as well as in individual countries,
to changes that now raise the distinct possibility of future population decline in a
non-negligible number of nations. These changes are in turn intimately connected
to profound changes in family life and most particularly in fertility—trends in how
many women, on average, remain childless over their lifetimes, and for those women
who become mothers, how many births they will have. What is especially intriguing
is “American exceptionalism”—that the United States appears to have been largely
immune, at least to date, from demographic trends that are so pronounced and potentially worrisome in so many other advanced industrialized nations. I review what lies
behind the shift from exploding populations to the possibility of population decline
in at least some parts of the world, and then speculate on what may be the likely
sources of why the United States has been an exception to these trends. This then
leads me to highly speculative remarks about why two specific groups very often
seen in a negative light—immigrants and women who give birth outside of formal
marriage—have played an important role in American demographic exceptionalism,
and why these groups may likewise continue to be a major factor in why the future of
the United States may be far rosier than that of other advanced industrialized nations.
However, I caution that this optimistic scenario depends crucially on realizing the
social, economic, and demographic potential of these subpopulations.
In this essay, I review what demographers regard as perhaps the most striking family trend to have emerged over the last century—a shift from what appeared to be
exploding populations, both in the world at large as well as in individual nations,
because too many were having too many children, to the emergence in a growing
number of nations of what appears to be a shift in which too many are having too
few children.
Why might we care about these issues? On one hand, Americans tend to regard the
issue of who chooses to remain childless, or how many children are born to those who
become parents, as very private matters, to be decided by a pregnant woman or the
prospective parents. But we also have a collective interest in children because they
constitute the future of any society, and this in turn means that we might worry if too
many have too few children. What is especially intriguing is “American exceptionalism,” that the United States appears to be largely immune to what is so pronounced
and potentially worrisome in a growing number of nations.
Emerging Trends in the Social and Behavioral Sciences. Edited by Robert Scott and Stephen Kosslyn.
© 2015 John Wiley & Sons, Inc. ISBN 978-1-118-90077-2.
1
2
EMERGING TRENDS IN THE SOCIAL AND BEHAVIORAL SCIENCES
So how can it be that worries about an exploding world population have turned into
worries about too many having too few children? The correct answer, in my view, is
that it remains the case that in some nations, too many are having too many children,
with these nations continuing to have far too rapid population growth. There is thus
a broad consensus among social scientists that these countries would benefit were
rapid population growth to be curbed. But in other nations, there have been emerging
trends that look as if too many are having too few children; thus, there has been a
growing concern, which I share, that these countries would benefit were these trends
to be curbed.
In this essay, I review what lies behind the shift from exploding populations to the
possibility of population decline. I then discuss what are the likely sources of why
the United States has been an exception to trends seen in so many other developed
nations of the world. This discussion then leads to highly speculative remarks on
my part regarding the future of US, which in my view is likely to be substantially
more promising than for most other highly industrialized nations. However, I also
note that this optimistic scenario depends crucially on realizing the “demographic
potential” of subpopulations that have often been viewed as problematic. This leads
me to conclude that these issues will pose difficult but critically important challenges
in the coming decades.
THE FIRST DEMOGRAPHIC TRANSITION
In 1968, Paul Ehrlich published the Population Bomb, in which he argued that
the world’s population was growing much too rapidly and that there would
soon be very dire consequences. Ehrlich’s argument was in fact not new
at all—exactly 180 years earlier, in 1798, Thomas Malthus had also argued
that rapid increases in population would lead to widespread misery. Both
Malthus and Ehrlich thus summarized the pervasive fear that the world’s
population was growing too quickly at what appeared to be an exponential
rate, and that this ticking time bomb would soon have catastrophic effects.
Indeed, such fears are common even today.
Some sense of why Malthus and Ehrlich thought as they did can be gleaned
from Table 1, which gives a condensed history of the world’s population
growth that answers a simple question: How long has it taken for the world’s
population to double in size? The story begins in 480 BC, when the world’s
population is estimated to have been about 110 million. It wasn’t until 800
AD that the world’s population reached 220 million, thus taking an estimated 1280 years to double. In 1330, or 530 years later, the world’s population
doubled again, and it doubled again between 1330 and 1810, fluctuating dramatically during this period because of a variety of factors including the
Black Plague and inclement weather conditions spurring crop failures and
famine. Then around the early 1800s, the world’s population began growing
very rapidly. The number of human beings alive doubled in the 100 years
between 1810 and 1910, doubling again in 57 years, and again in 45 years,
reaching the 7 billion people estimated to have been alive in 2012.
Recent Demographic Trends and the Family
3
Table 1
Doubling of the World’s Population through History
Date
480 BC
800 AD
1330 AD
1810 AD
1910 AD
1967 AD
2012 AD
Population
(millions)
Years to Double
(population size)
110
220
440
875
1750
3.500
7.000
1280
530
480
100
57
45
Sources: US Census Bureau, Historical Estimates of World Population.
US Census Bureau, Total Midyear Population for the World, 1950–2050.
So Table 1 shows that it once took 1280 years for the world’s population to
double, but the most recent doubling took only 45 years. This would seem
to say that Malthus and Ehrlich were right and that we are in the midst of
a ticking population time bomb. And if so, how many years will it take for
the world’s population to double again, from 7 to 14 billion? Will the next
doubling be in about 30, 40, 50, or 60 years?
Perhaps surprisingly, the answer is “none of the above” (Lam, 2012). Why
this might be requires stepping back a bit. For demographers, the assertion
that the world’s population will continue to explode in size is a claim
about population dynamics. This in turn requires a detailed understanding
of demography’s “big three”: fertility, mortality, and migration. That is,
to know how many people will be in the US in 2020, we need to know
the size of the US population in 2010, plus births between 2010 and 2020,
minus deaths during this same period, plus the numbers who move into the
US, minus the numbers who move out of the US But if population size is
determined by fertility, mortality, and migration, then it necessarily follows
that understanding population change requires describing change in fertility,
mortality, and migration. It is these aspects of population dynamics—how
fertility, mortality, and migration have, or will, change—that make these
population issues both much more interesting and much more challenging
to social scientists. Indeed, thinking through change in just two of these
components, fertility and mortality, will provide us with more than enough
to cover. But this is also why the story in Table 1 is only a part of the story,
and why most demographers believe, unlike Malthus and Ehrlich, that 7
billion now will not lead to 14 billion anytime in the future.
So if Table 1 tells only an incomplete story, what is the larger, more
complete story? The answer is something that demographers call the first
4
EMERGING TRENDS IN THE SOCIAL AND BEHAVIORAL SCIENCES
demographic transition (see, e.g., Bulatao & Casterline, 2001; Coale &
Watkins, 1986; Lee, 2003; Notestein, 1953). The way I will be relating things
will be characterize the first demographic transition as a set of stylized facts.
The idea behind the first demographic transition is in one sense quite simple, but what is less simple is the story’s implications, which are less obvious
and thus more interesting. And here’s how this story goes. For nearly all of
human history (and thus before the first demographic transition), both mortality and fertility were very high. Fertility tended to be a bit higher than
mortality, but only very slightly, and this meant that the world’s population
grew, but only very slowly. Fastforwarding to today and looking at a country
like the US, we get to a situation of both low mortality and low fertility. So
the story is one of high fertility and high mortality pretransition, and of low
fertility and low mortality posttransition.
The final piece of the puzzle is what happens mid-transition, in the middle
of the first demographic transition, which is also the most interesting part of
the story. And this part of the story is that mortality first declines, followed
by a decline in fertility. Thus, the first demographic transition involves: (i) an
initial pretransition period characterized by high fertility and high mortality, then (ii) a transitional period in which mortality first declines followed
by a decline in fertility, and then (iii) a posttransition period in which both
mortality and fertility are low.
What is implied by the above helps explain why Malthus and Ehrlich
were wrong. Thus, for nearly all of human history, slow population growth
resulted from births and deaths more or less cancelling out one another. But
then, we enter a transitional period in which mortality declines, meaning
fewer deaths, but fertility remains high, meaning as many births as previously. But more births plus fewer deaths equals rapid population growth,
and this strikingly new phenomenon seemed to imply a population time
bomb to observers such as Malthus and Ehrlich. But what they did not
realize was the other crucial part of the first demographic transition, which
is that fertility does not remain high, but eventually declines, but only after
mortality has begun its decline. And once fertility decline has begun (or in
some versions of the story, once it passes a certain threshold), it does not
reverse; thus, without exception, demographers have observed that high
levels of fertility pretransition eventually declines to much lower levels
posttransition—with no exceptions to date, no nation or and region has
gone through the first demographic transition and returned to pretransition
levels of high fertility.
The first demographic transition thus explains why Malthus and Ehrlich
were so alarmed, but also why 7 billion in 2012 will not turn into 14 billion
in the future. In the 1950s and 1960s, a very large number of countries had
experienced recent and quite marked declines in mortality. But because these
Recent Demographic Trends and the Family
5
mortality declines were recent, they were not yet accompanied by a decline in
fertility. As a result, the world’s population of humans soared in the middle
of the twentieth century, increasing at an extremely rapid rate. But what was
less obvious in the mid-twentieth century was that fertility decline would
also take place. So it is fertility decline that is the key to why the 7 billion
humans alive in 2012 will almost certainly not imply 14 billion humans in the
future. It is also what completes the story that Table 1 tells. That is, for most
of human history, fertility and mortality were high but mostly cancelled, so
that population growth was slow. This implies a long time for the world’s
population to double in size, which is what we see in Table 1. Then at some
point, mortality begins to decline, but fertility remains high, resulting in the
historically very rapid increases in population that we also see in Table 1. At
a last stage, mortality decline is accompanied by fertility decline, and we see
a hint of this in Table 1 in the slowing of the doubling time for the world’s
population.
THE EMERGENCE OF VERY LOW FERTILITY
As noted above, part of the story told by the first demographic is that for
nearly all of human history, births and deaths very nearly balanced one
another, and this historical balancing act led many demographers to assume
that once a nation had finished its first demographic transition, things
would again balance and, in particular, that births would settle down into
levels that would, as before, yield little or no population growth. What thus
surprised many was the emergence of very low levels of fertility, something
that first occurred in Italy, Spain, and Japan, but which now has diffused
much more widely.
“Replacement fertility” is the term demographers use to describe a level of
fertility that would imply neither population growth nor population decline
were it to be maintained for a very long time. Thus, when mortality is low,
replacement fertility would occur, for example, if each person in a generation
were to have two children over their lifetime, thus “replacing” their parents.
Demographers usually put replacement fertility a bit higher, at 2.1 children
per woman, to deal with the relatively small numbers of those who die before
reaching the typical ages of childbearing.
Thus, what was surprising about Italy, Spain, and Japan was that these
nations were the first to experience extremely low levels of fertility (Kohler,
Billari, & Ortega, 2002; McNicoll, 2012). How consequential is subreplacement fertility? Any answer to this question has to be speculative, in that it is
within the realm of possibility that countries currently experiencing extreme
levels of subreplacement fertility may experience a future reversal. But we
can nevertheless give fairly precise answers under the speculative “what if”
6
EMERGING TRENDS IN THE SOCIAL AND BEHAVIORAL SCIENCES
Table 2
Years until a Nation’s Population will Decline by a Factor of 2 over
the Long Run were there to be a Constant Level of Subreplacement
Fertility
Number of births
per woman
Years until population halving
2.0
1.9
1.8
1.7
1.6
1.5
1.4
1.3
1.2
1.1
1.0
901
279
161
112
84
66
54
45
38
33
29
Source: Author’s calculations using an expression of Kohler et al. (2002).
scenario of “what if a nation’s fertility remained at a particular subreplacement level for a long time.” Table 2 gives these numbers, presenting them
in much the same way as in Table 1, but whereas Table 1 asked how long it
took for population to double in size, Table 2 asks how long it would take for
population to halve in size—that is, decrease by a factor of two—under the
“what if” scenario in which fertility remains at a particular subreplacement
level for a very long time.
What Table 2 shows is that if fertility in a population were to remain just a
bit below replacement, population decline will be very gradual, but that at
lower levels of subreplacement levels of fertility, population decline becomes
extremely rapid. Thus, were a hypothetical nation to have an average of 1.9
children per woman rather than the replacement level of 2.1 and were this to
continue for a long time, this hypothetical nation’s population would indeed
decline, but quite slowly, taking roughly 280 years to halve in size. However,
were a hypothetical nation to have an average of 1.5 children per woman
and were this to continue for a long time, this hypothetical nation’s population would take only 66 years to halve in size—an extremely rapid pace of
population decline.
These issues are potentially worrisome in that a large and growing number of nations are currently at subreplacement levels of fertility. Countries
whose total fertility rate (TFR) is 1.5 or less in 2010 include the European
nations of Austria, Germany, Greece, Italy, Portugal, Spain, and Switzerland;
Russia and the former Soviet-bloc nations of Belarus, Bosnia and Herzegovina, Bulgaria, Croatia, Czech Republic, Hungary, Latvia, Lithuania, Serbia,
Poland, Romania, Slovenia, and Ukraine; and the Asian countries of Japan,
Hong Kong, Macao, Singapore, South Korea, and Thailand. China’s TFR is
estimated to be 1.63 in 2010.
As noted above, one caution is that the potential consequences of low fertility as given by the scenarios in Table 2 rest on the assumption that current
levels of fertility seen in 2010 will continue indefinitely into the future. Yet
another important set of cautions, somewhat technical in nature, concerns
Recent Demographic Trends and the Family
7
how to interpret fertility trends based on TFRs. An alternative way to gauge
fertility trends would be to take a group of women born in the same year
and follow them over their reproductive years, from which we could determine the average numbers of children born to this cohort of women. The
difficulty with using such a cohort measure to gauge fertility trends is that
it takes a long time—for those born in 1990, we could not determine their
completed fertility until around 2040. Because of this, demographers instead
typically compute TFRs, which are a “period” measure of fertility. In this
approach, TFRs for 2010 are constructed using the number of births in 2010 to
women aged 15–19, 20–24, etc., adjusting for the number of women in these
age groups. An advantage of the TFR is that it can be readily obtained in
any given calendar year; however, when the fertility behaviors are changing
rapidly for successive birth cohorts of women, fertility trends based on TFR’s
can be misleading. I return to this issue below.
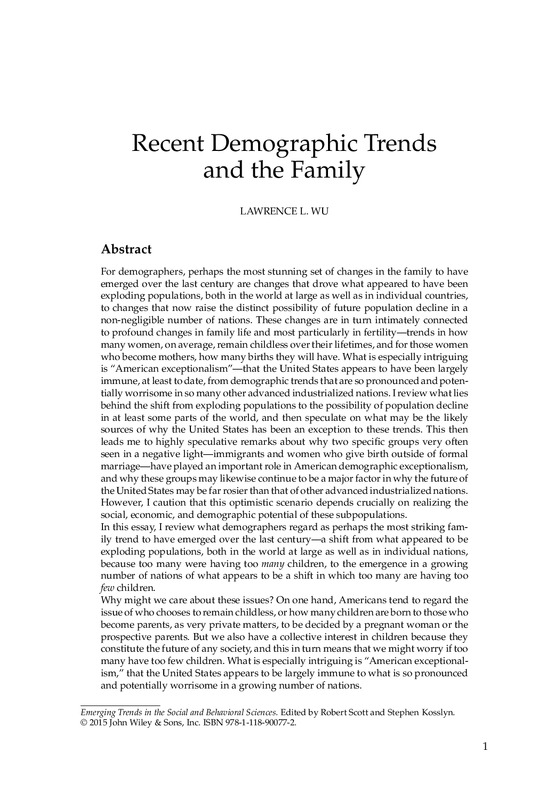
Figure 1 looks specifically at two countries, the United States and Japan,
with the United States having fertility that has been close to replacement
levels for several decades and with Japan having had fertility well below
replacement for several decades. The upper-left-hand panel of Figure 1
shows that fertility in the United States peaked during the baby boom at 3.7
per woman in the mid-1950s, dipped slightly below replacement during the
1970s and 1980s, and then increased to just below replacement levels. Japan
had a much briefer baby boom, with fertility declining from 3.0 children per
women in 1950 to by replacement levels through the 1960s; subreplacement
levels began in 1970.
Thus, Figure 1 shows that Japan has had subreplacement levels of fertility
for about 40 years whereas the United States experienced roughly replacement levels during this same period. The consequences can be seen in the
lower panels of Figure 1, which give “age pyramids” showing the 2010 age
composition for the United States and Japan. The US baby boom is visible
as a slight bulge in the age distribution around ages 50 and 60, and there is
a similar bulge around the teens and 1920s reflecting children of the baby
boomers. Nevertheless, there are roughly the same numbers of people in the
US population who were aged 55 or younger in 2010, with (for example) the
numbers of females between age 59 or younger ranging from a high of 10.58
million aged 20–24 to a low of 9.89 million aged 10–14. At later ages, mortality begins to thin the ranks at older ages, thus producing a classic “pyramid”
shape at older ages.
The age pyramid for Japan is quite different, particularly at younger ages.
The Japanese baby boom shows up as a very sharp peak at ages 60–64, with
the children of the Japanese baby boomers showing up as another sharp peak
at ages 35–39, reflecting the more highly compressed range of ages at which
baby-boom parents in Japan had their children. But the nearly four decades of
8
EMERGING TRENDS IN THE SOCIAL AND BEHAVIORAL SCIENCES
4.0
4.0
United states
3.5
Total fertility rate
Total fertility rate
3.5
Japan
3.0
2.5
2.0
3.0
2.5
2.0
1.5
1.5
1.0
1950 1960 1970 1980 1990 2000 2010
1.0
1950 1960 1970 1980 1990 2000 2010
Year
Year
Females
Males
Females
Males
100
90
80
70
60
50
40
30
20
10
0
12
9
6
3
0
100
90
80
70
60
50
40
30
20
10
0
0
3
6
9
12
6
4
2
0
0
2
4
6
Figure 1 Change in fertility between 1950 and 2010 (upper panels) and the 2010
population age structure (lower panels) for the United States and Japan.
subreplacement fertility can be easily seen in the sharply declining numbers
at younger ages in Japan’s 2010 age distribution.
Increases in life expectancy in the US and Japan mean, for example, that
baby boomers in both countries will live longer than those born earlier in the
twentieth century. As a result, what the future holds for both countries is a
rapidly aging population, but Figure 1 also makes clear that population aging
in Japan will be far more rapid than in the United States as the consequence
of Japan’s roughly four decades of subreplacement fertility. This is why a
panel of experts concluded in a report published by the National Academy
of Sciences that the pace of population aging in the United States will depend
crucially on whether US fertility remains at roughly replacement levels or, as
has been the case in Japan and so many other countries, begins to decline to
much lower levels (National Research Council, 2012).
Why has fertility fallen to subreplacement levels in so many nations and,
conversely, why is it at roughly replacement levels in the United States? The
Recent Demographic Trends and the Family
9
answers to these questions are hotly debated by social scientists, so there is no
scientific consensus that would provide definitive answers to these questions
(Bulatao & Casterline, 2001; Hirschman, 1994; Kohler et al., 2002; McDonald,
2000; McNicoll, 2012; Morgan, 2003; Pritchett & Viarengo, 2012). Nevertheless, I have found that a hypothetical thought experiment provides some
useful insights into the emergence of subreplacement levels of fertility (Wu,
2010; see also McDonald, 2000).
So in this thought experiment, consider a hypothetical birth cohort of
women that we follow over their reproductive years and suppose further
that some women in this cohort have no children, others one, two, or three
children, but that no woman has more than three births. If so, then the average number of children per woman will be simply a weighted average—the
fraction having zero children times zero, the fraction having one child
times one, and so forth. But it also turns out to be very difficult to get to
replacement fertility under this hypothetical fertility regime. The reason is
that if even fairly modest proportions in this cohort remain childless or have
only one child, then very large proportions having three births are needed
to achieve replacement fertility.
Table 3 gives selected results from this thought experiment, with the different panels assuming different proportions of those who are childless or
who have only one birth. For example, the first panel assumes that 15% of
women are childless and that another 15% have only one birth; then because
percentages must sum to 100%, the remaining 70% must have either two or
three births. Thus, the different rows in this first panel, which consider what
happens when there are different percentages who have two or three births,
show that the 2.1 replacement level of fertility cannot be obtained unless a
small percentage (15%) have two children and a very large percentage (55%)
have three births. The second panel supposes that 20% of women are childless, slightly more than in the previous example, and that 15% have only one
child, as before. Under this hypothetical fertility regime, the 2.1 replacement
level of fertility is not reached unless until the vast majority (65%) of women
have three births and none have two births.
The remaining panels, which consider progressively larger numbers who
are childless or who have only one birth, yield a similar pattern of results.
In the third panel, in which 20% have no births and another 20% have only
one birth, it is now impossible to get to replacement levels of fertility even
when all of the remaining 60% of women have three births. The two remaining panels consider situations in which 30% remain childless; under these
hypothetical fertility regimes, it is likewise impossible to achieve replacement
levels.
There are four main takeaways to be drawn from this admittedly hypothetical thought exercise. The first is that this hypothetical fertility regime,
10
EMERGING TRENDS IN THE SOCIAL AND BEHAVIORAL SCIENCES
Table 3
Mean Number of Lifetime Births for Hypothetical Cohorts of Women
Who do not Proceed Past a Third Birth by Selected Proportions
with 0–3 Births
Number of Lifetime Births
0
0.15
0.15
0.15
0.15
0.15
0.15
0.20
0.20
0.20
0.20
0.20
0.20
0.20
0.20
0.20
0.20
0.20
0.20
0.20
0.20
0.30
0.30
0.30
0.30
0.30
0.30
0.30
0.30
0.30
0.30
0.30
1
2
3
Completed Fertility
0.15
0.15
0.15
0.15
0.15
0.15
0.15
0.15
0.15
0.15
0.15
0.15
0.15
0.20
0.20
0.20
0.20
0.20
0.20
0.20
0.20
0.20
0.20
0.20
0.20
0.20
0.30
0.30
0.30
0.30
0.30
0.60
0.50
0.40
0.30
0.20
0.15
0.60
0.50
0.40
0.30
0.20
0.10
0.00
0.60
0.50
0.40
0.30
0.20
0.10
0.00
0.50
0.40
0.30
0.20
0.10
0.00
0.40
0.30
0.20
0.10
0.00
0.10
0.20
0.30
0.40
0.50
0.55
0.05
0.15
0.25
0.35
0.45
0.55
0.65
0.00
0.10
0.20
0.30
0.40
0.50
0.60
0.00
0.10
0.20
0.30
0.40
0.50
0.00
0.10
0.20
0.30
0.40
1.65
1.75
1.85
1.95
2.05
2.10
1.50
1.60
1.70
1.80
1.90
2.00
2.10
1.40
1.50
1.60
1.70
1.80
1.90
2.00
1.20
1.30
1.40
1.50
1.60
1.70
1.10
1.20
1.30
1.40
1.50
in which no woman has more than three births, is actually reasonably
realistic—results from numerous social surveys show that most desire two
children and very few say that their ideal family size consists of four or
more children (see, e.g., Morgan, 2003). The second, which is the converse of
the first, is that achieving fertility levels approximating replacement levels
of 2.1 births per woman will very likely require that some women give birth
Recent Demographic Trends and the Family
11
to four or more children. The third concerns the crucially important role
played by women who are childless or who have only one birth. When these
proportions are in the range of 15% or 20%, it can be easy to obtain levels of
subreplacement fertility in the range of 1.6 to 1.8. The fourth and perhaps
most important takeaway is that Table 3 suggests that it is not difficult to
achieve extremely low fertility levels in the range of, say, 1.4 to 1.5 when the
percent who are childless or who have only birth are around 20% or 30%.
How realistic are the hypothetical scenarios in Table 3? Biddlecom and
Martin (2006) document that childlessness among US women aged 40–44
was 10% in 1976, 18% in 1995, and 19% in 2003. They also find a positive
correlation between childless and education, with childlessness rising with
education. But in Germany, whose TFR was 1.36 in 2010, childlessness has
been substantially higher, with more than a third of German women born in
1965 expected to remain childless (Dobritz & Gartner, 1999, cited in Kohler
et al., 2002).
SPECULATIONS ON US EXCEPTIONALISM
Why might the United States be an exception to what is occurring in so
many other highly industrialized nations? It is important to acknowledge
that there are other industrialized nations that have relatively high fertility.
On the basis of estimates for the calendar year 2010, these include the
Netherlands (1.75), Belgium (1.82), Finland (1.83), Denmark (1.86), United
Kingdom (1.88), Sweden (1.89), Norway (1.92), and France (1.97). But only
three countries have fertility that exceeded the US level of 2.06—Iceland
(2.13), New Zealand (2.14), and Israel (2.91). Israel’s high fertility may be a
reaction to the high fertility by Palestinians, with the latter standing at 4.42.
Clearly, the United States is not alone in having levels of fertility well above
the low levels of, say, 1.5, observed in so many other highly industrialized
countries, but it is clearly among a very few in which fertility is essentially
at replacement levels.
These considerations are why social scientists see the US fertility as “high”
relative to most other highly industrialized nations. There is, however, no corresponding consensus for what accounts for US exceptionalism, so that what
follows are my speculations about factors that might account for why the
United States is so different. And in what follows, I will use the phrase “relatively high” to refer to the fact that US fertility is essentially at replacement
levels and thus higher than in nearly all other highly industrialized countries.
•
Poverty. Social scientists have long observed that those in disadvantaged
segments of society tend to have more children than those in more
advantaged segments of society, with this pattern seen not just in the
12
EMERGING TRENDS IN THE SOCIAL AND BEHAVIORAL SCIENCES
•
•
•
United States but in other countries as well. Thus one plausible reason
for why US fertility is relatively high is that the US has more who are
poor.
Affluence. Yet another likely contributor to US exceptionalism is the
higher fertility in advantaged groups, at least when compared to their
advantaged counterparts in other countries. For example, women aged
40–44 with college degree or more had an average of 1.77 children, a
level higher than current fertility in the Netherlands. (I obtained these
and other estimates reported in this section using data on women aged
40–44 from the 2006—2010 National Survey of Family Growth).
Immigration. Social scientists have long observed that immigrants have
more children and this is true for US immigrants as well. Thus, women
aged 40–44 who were foreign-born had an average of 2.75 births whereas
those born in the United States averaged 2.02 births, a difference of .73
births.
Nonmarital Fertility. Childbearing outside of formal marriage has
increased substantially in the United States (Wu, 2008), with over 40%
of US births now occurring outside of formal marriage (Hamilton,
Martin, & Ventura, 2013). Women aged 40–44 who had a premarital first
birth averaged 0.47 more births than those who had a marital first birth.
DISCUSSION
In most highly industrialized countries, fertility is below replacement and
sometimes substantially so. The list of such countries is long: in 2010, nations
with fertility averaging 1.5 or fewer births per woman included: Germany
(1.36), Portugal (1.36), Italy (1.39), Greece (1.46), Switzerland (1.47), Spain
(1.51), Hungary (1.33), Poland (1.33), Ukraine (1.39), the Czech Republic
(1.43), Russia (1.44), Hong Kong (1.03), Taiwan (1.11), South Korea (1.23),
Singapore (1.26), Japan (1.34), and Cuba (1.5). Fertility levels in Canada (1.63)
and China (1.63) are only a bit higher. There is growing concern among social
scientists about the potentially quite harmful societal impacts were fertility
to remain at such very low levels. And perhaps not surprisingly, policy makers in many of these countries have begun implementing policies intended
to raise fertility. Whether such policies have or can be successful remains an
open question that continues to be hotly debated in the research community.
One notable exception has been the United States, where fertility has been at
or near replacement levels for over four decades. Because of this, the United
States possesses what I think might be most accurately characterized as a
type of “demographic potential”—the prospect that the numbers in future
Recent Demographic Trends and the Family
13
generations will be roughly the same as in current generations. This “demographic potential” will by no means solve all problems; indeed, increasing life expectancy across the developed and developing world will imply
rapidly aging populations in the US and elsewhere. But population aging
will be far more rapid in countries in which fertility is substantially below
replacement, something we have seen in vivid detail when comparing the
situations of the United States and Japan.
My argument is thus that US fertility constitutes the “demographic” part
of this “demographic potential,” and I likewise am deliberately using the
word “potential” to emphasize that potential benefits are in no way automatic. Among the likely factors behind higher US fertility is the higher fertility of disadvantaged groups in the United States. Thus, fertility is higher,
for example, among recent immigrants and among those who have children
outside of formal marriage. But these factors create additional challenges. A
first is the challenge of narrowing the gap between children raised in disadvantaged versus advantaged circumstances. That is, a society will more
fully realize its demographic potential when children more fully realize their
potential in adulthood. A second challenge is political, in that immigration
and out-of-wedlock childbearing are highly charged topics politically. These
and other issues thus pose real challenges to realizing the potential of the
demographic advantages that the United States possesses.
Still, the larger issue is that we care about children because they carry the
future of any society. The United States is in the enviable position of looking
to a future in which there will very likely be sufficient numbers in both current and future generations of children. Perhaps one small step to addressing
these and other challenges is for more of us to more fully recognize the many
ways in which societies benefit when there are sufficient numbers populating
future generations.
REFERENCES
Biddlecom, A., & Martin, S. P. (2006). Childless in America. Contexts, 5, 54.
Bulatao, R. A., & Casterline, J. B. (2001). Global fertility transition. New York, NY: Population Council.
Coale, A. J., & Watkins, S. C. (1986). The decline of fertility in Europe. Princeton, NJ:
Princeton University Press.
Ehrlich, P. (1968). The population time bomb. New York, NY: Ballantine Books.
Hamilton, B. E., Martin, J. A., & Ventura, S. J. (2013). Births: Preliminary data for
2012. National vital statistics reports 62. Hyattsville, MD: National Center for Health
Statistics.
Hirschman, C. (1994). Why fertility changes. Annual Review of Sociology, 20, 203–233.
Kohler, H.-P., Billari, F. C., & Ortega, J. A. (2002). The emergence of lowest-low fertility in Europe during the 1990s. Population and Development Review, 28, 641–680.
14
EMERGING TRENDS IN THE SOCIAL AND BEHAVIORAL SCIENCES
Lam, D. (2012). How the world survived the population bomb: Lessons from 50 years
of exceptional demographic history. Demography, 48, 1231–1262.
Lee, R. (2003). The demographic transition: Three centuries of fundamental change.
Journal of Economic Perspectives, 17, 167–190.
Malthus, T. R. (1798). An Essay on the Principle of Population. London, England: J. Johnson.
McDonald, P. (2000). Gender equity, social institutions and the future of fertility. Journal of Population Research, 17, 1–15.
McNicoll, G. (2012). Reflections on post-transition demography. Population and Development Review, 38, 3–19.
Morgan, S. P. (2003). Is low fertility a twenty-first-century demographic crisis?
Demography, 40, 589–603.
National Research Council (2012). Aging and the macroeconomy: Long-term implications
of an older population. Washington, DC: The National Academies Press.
Notestein, F. W. (1953). Economic problems of population change. Proceedings of the
Eighth International Conference of Agricultural Economists, 13–31.
Pritchett, L., & Viarengo, M. (2012). Why demographic suicide? The puzzles of European fertility. Population and Development Review, 38, 55–71.
Wu, L. L. (2008). Cohort estimates of nonmarital. Demography, 45, 193–207.
Wu, L. L. (2010). U.S. fertility in 2050: Some speculative remarks. Keynote address,
Institute of European and American Studies, Academia Sinica, Taipei.
LAWRENCE L. WU SHORT BIOGRAPHY
Lawrence L. Wu is Professor of Sociology and Director of the Population
Center at New York University. He is a recognized authority on nonmarital
fertility, family demography, and event history methods, with his research
in these area having received funding from National Institutes of Health,
the National Science Foundation, the William T. Grant Foundation, and the
Assistant Secretary for Program Evaluation. He has been a Fellow at Center
for Advanced Study in the Behavioral Sciences (1991–1992); Faculty Scholar
of the William T. Grant Foundation (1992–1998); and Distinguished Alumni
Scholar, Stanford University (2010). He was previously a faculty member at
the University of Wisconsin-Madison and Princeton University, and has held
visiting positions at Columbia and Yale. He has chaired the American Sociological Associations (ASA) Sections on Population (2006–2007) and Quantitative Methodology (2003–2005); the Technical Review Committee (2002–2006),
an advisory panel to the National Longitudinal Surveys; and the ASA Committee on the Status of Gays, Lesbians, Bisexuals in Sociology (1996). He has
served as a member of the Board of Directors of the Population Association of
America (2002–2005), the ASA Committee on Nominations (1999–2000), the
Council of the ASA Section on Quantitative Methodology (1997–1999), the
Board of Overseers of the Panel Study of Income Dynamics (1996–2002); and
Recent Demographic Trends and the Family
15
was co-organizer (with P. Gottschalk and R. Moffitt) of the Annual Summer
Research Workshop on Problems of the Low-Income Population, Institute for
Research on Poverty, University of Wisconsin-Madison (1998–2005). He currently serves as series editor (with M. Alvarez, N. Beck, and S. Morgan) of
Analytical Methods for Social Research (Cambridge, 2003-present) and as book
review editor of Sociological Methods and Research (2000-present).
RELATED ESSAYS
The Sexual Division of Labor (Anthropology), Rebecca Bliege Bird and Brian
F. Codding
Parenting with Digital Devices (Psychology), Pamela E. Davis-Kean and
Sandra Tang
Intergenerational Mobility (Economics), Steve N. Durlauf and Irina
Shaorshadze
Sexual Behavior (Anthropology), Melissa Emery Thompson
Patterns of Attachment across the Lifespan (Psychology), Robyn Fivush and
Theodore E. A. Waters
Family Relationships and Development (Psychology), Joan E. Grusec
Divorce (Sociology), Juho Härkönen
Grandmothers and the Evolution of Human Sociality (Anthropology), Kristen
Hawkes and James Coxworth
Family Formation in Times of Labor Market Insecurities (Sociology), Johannes
Huinink
Cultural Neuroscience: Connecting Culture, Brain, and Genes (Psychology),
Shinobu Kitayama and Sarah Huff
Maternal and Paternal Employment across the Life Course (Sociology),
Michaela Kreyenfeld
Intergenerational Mobility: A Cross-National Comparison (Economics),
Bhashkar Mazumder
The Future of Marriage (Sociology), Elizabeth Aura McClintock
Below-Replacement Fertility (Sociology), S. Philip Morgan
Limits to Human Longevity (Sociology), Samuel H. Preston and Hiram
Beltrán-Sánchez
Demography and Cultural Evolution (Anthropology), Stephen Shennan
Family Income Composition (Economics), Kristin E. Smith
Social Neuroendocrine Approaches to Relationships (Anthropology), Sari M.
van Anders and Peter B. Gray
Transnational Work Careers (Sociology), Roland Verwiebe
-
Recent Demographic Trends
and the Family
LAWRENCE L. WU
Abstract
For demographers, perhaps the most stunning set of changes in the family to have
emerged over the last century are changes that drove what appeared to have been
exploding populations, both in the world at large as well as in individual countries,
to changes that now raise the distinct possibility of future population decline in a
non-negligible number of nations. These changes are in turn intimately connected
to profound changes in family life and most particularly in fertility—trends in how
many women, on average, remain childless over their lifetimes, and for those women
who become mothers, how many births they will have. What is especially intriguing
is “American exceptionalism”—that the United States appears to have been largely
immune, at least to date, from demographic trends that are so pronounced and potentially worrisome in so many other advanced industrialized nations. I review what lies
behind the shift from exploding populations to the possibility of population decline
in at least some parts of the world, and then speculate on what may be the likely
sources of why the United States has been an exception to these trends. This then
leads me to highly speculative remarks about why two specific groups very often
seen in a negative light—immigrants and women who give birth outside of formal
marriage—have played an important role in American demographic exceptionalism,
and why these groups may likewise continue to be a major factor in why the future of
the United States may be far rosier than that of other advanced industrialized nations.
However, I caution that this optimistic scenario depends crucially on realizing the
social, economic, and demographic potential of these subpopulations.
In this essay, I review what demographers regard as perhaps the most striking family trend to have emerged over the last century—a shift from what appeared to be
exploding populations, both in the world at large as well as in individual nations,
because too many were having too many children, to the emergence in a growing
number of nations of what appears to be a shift in which too many are having too
few children.
Why might we care about these issues? On one hand, Americans tend to regard the
issue of who chooses to remain childless, or how many children are born to those who
become parents, as very private matters, to be decided by a pregnant woman or the
prospective parents. But we also have a collective interest in children because they
constitute the future of any society, and this in turn means that we might worry if too
many have too few children. What is especially intriguing is “American exceptionalism,” that the United States appears to be largely immune to what is so pronounced
and potentially worrisome in a growing number of nations.
Emerging Trends in the Social and Behavioral Sciences. Edited by Robert Scott and Stephen Kosslyn.
© 2015 John Wiley & Sons, Inc. ISBN 978-1-118-90077-2.
1
2
EMERGING TRENDS IN THE SOCIAL AND BEHAVIORAL SCIENCES
So how can it be that worries about an exploding world population have turned into
worries about too many having too few children? The correct answer, in my view, is
that it remains the case that in some nations, too many are having too many children,
with these nations continuing to have far too rapid population growth. There is thus
a broad consensus among social scientists that these countries would benefit were
rapid population growth to be curbed. But in other nations, there have been emerging
trends that look as if too many are having too few children; thus, there has been a
growing concern, which I share, that these countries would benefit were these trends
to be curbed.
In this essay, I review what lies behind the shift from exploding populations to the
possibility of population decline. I then discuss what are the likely sources of why
the United States has been an exception to trends seen in so many other developed
nations of the world. This discussion then leads to highly speculative remarks on
my part regarding the future of US, which in my view is likely to be substantially
more promising than for most other highly industrialized nations. However, I also
note that this optimistic scenario depends crucially on realizing the “demographic
potential” of subpopulations that have often been viewed as problematic. This leads
me to conclude that these issues will pose difficult but critically important challenges
in the coming decades.
THE FIRST DEMOGRAPHIC TRANSITION
In 1968, Paul Ehrlich published the Population Bomb, in which he argued that
the world’s population was growing much too rapidly and that there would
soon be very dire consequences. Ehrlich’s argument was in fact not new
at all—exactly 180 years earlier, in 1798, Thomas Malthus had also argued
that rapid increases in population would lead to widespread misery. Both
Malthus and Ehrlich thus summarized the pervasive fear that the world’s
population was growing too quickly at what appeared to be an exponential
rate, and that this ticking time bomb would soon have catastrophic effects.
Indeed, such fears are common even today.
Some sense of why Malthus and Ehrlich thought as they did can be gleaned
from Table 1, which gives a condensed history of the world’s population
growth that answers a simple question: How long has it taken for the world’s
population to double in size? The story begins in 480 BC, when the world’s
population is estimated to have been about 110 million. It wasn’t until 800
AD that the world’s population reached 220 million, thus taking an estimated 1280 years to double. In 1330, or 530 years later, the world’s population
doubled again, and it doubled again between 1330 and 1810, fluctuating dramatically during this period because of a variety of factors including the
Black Plague and inclement weather conditions spurring crop failures and
famine. Then around the early 1800s, the world’s population began growing
very rapidly. The number of human beings alive doubled in the 100 years
between 1810 and 1910, doubling again in 57 years, and again in 45 years,
reaching the 7 billion people estimated to have been alive in 2012.
Recent Demographic Trends and the Family
3
Table 1
Doubling of the World’s Population through History
Date
480 BC
800 AD
1330 AD
1810 AD
1910 AD
1967 AD
2012 AD
Population
(millions)
Years to Double
(population size)
110
220
440
875
1750
3.500
7.000
1280
530
480
100
57
45
Sources: US Census Bureau, Historical Estimates of World Population.
US Census Bureau, Total Midyear Population for the World, 1950–2050.
So Table 1 shows that it once took 1280 years for the world’s population to
double, but the most recent doubling took only 45 years. This would seem
to say that Malthus and Ehrlich were right and that we are in the midst of
a ticking population time bomb. And if so, how many years will it take for
the world’s population to double again, from 7 to 14 billion? Will the next
doubling be in about 30, 40, 50, or 60 years?
Perhaps surprisingly, the answer is “none of the above” (Lam, 2012). Why
this might be requires stepping back a bit. For demographers, the assertion
that the world’s population will continue to explode in size is a claim
about population dynamics. This in turn requires a detailed understanding
of demography’s “big three”: fertility, mortality, and migration. That is,
to know how many people will be in the US in 2020, we need to know
the size of the US population in 2010, plus births between 2010 and 2020,
minus deaths during this same period, plus the numbers who move into the
US, minus the numbers who move out of the US But if population size is
determined by fertility, mortality, and migration, then it necessarily follows
that understanding population change requires describing change in fertility,
mortality, and migration. It is these aspects of population dynamics—how
fertility, mortality, and migration have, or will, change—that make these
population issues both much more interesting and much more challenging
to social scientists. Indeed, thinking through change in just two of these
components, fertility and mortality, will provide us with more than enough
to cover. But this is also why the story in Table 1 is only a part of the story,
and why most demographers believe, unlike Malthus and Ehrlich, that 7
billion now will not lead to 14 billion anytime in the future.
So if Table 1 tells only an incomplete story, what is the larger, more
complete story? The answer is something that demographers call the first
4
EMERGING TRENDS IN THE SOCIAL AND BEHAVIORAL SCIENCES
demographic transition (see, e.g., Bulatao & Casterline, 2001; Coale &
Watkins, 1986; Lee, 2003; Notestein, 1953). The way I will be relating things
will be characterize the first demographic transition as a set of stylized facts.
The idea behind the first demographic transition is in one sense quite simple, but what is less simple is the story’s implications, which are less obvious
and thus more interesting. And here’s how this story goes. For nearly all of
human history (and thus before the first demographic transition), both mortality and fertility were very high. Fertility tended to be a bit higher than
mortality, but only very slightly, and this meant that the world’s population
grew, but only very slowly. Fastforwarding to today and looking at a country
like the US, we get to a situation of both low mortality and low fertility. So
the story is one of high fertility and high mortality pretransition, and of low
fertility and low mortality posttransition.
The final piece of the puzzle is what happens mid-transition, in the middle
of the first demographic transition, which is also the most interesting part of
the story. And this part of the story is that mortality first declines, followed
by a decline in fertility. Thus, the first demographic transition involves: (i) an
initial pretransition period characterized by high fertility and high mortality, then (ii) a transitional period in which mortality first declines followed
by a decline in fertility, and then (iii) a posttransition period in which both
mortality and fertility are low.
What is implied by the above helps explain why Malthus and Ehrlich
were wrong. Thus, for nearly all of human history, slow population growth
resulted from births and deaths more or less cancelling out one another. But
then, we enter a transitional period in which mortality declines, meaning
fewer deaths, but fertility remains high, meaning as many births as previously. But more births plus fewer deaths equals rapid population growth,
and this strikingly new phenomenon seemed to imply a population time
bomb to observers such as Malthus and Ehrlich. But what they did not
realize was the other crucial part of the first demographic transition, which
is that fertility does not remain high, but eventually declines, but only after
mortality has begun its decline. And once fertility decline has begun (or in
some versions of the story, once it passes a certain threshold), it does not
reverse; thus, without exception, demographers have observed that high
levels of fertility pretransition eventually declines to much lower levels
posttransition—with no exceptions to date, no nation or and region has
gone through the first demographic transition and returned to pretransition
levels of high fertility.
The first demographic transition thus explains why Malthus and Ehrlich
were so alarmed, but also why 7 billion in 2012 will not turn into 14 billion
in the future. In the 1950s and 1960s, a very large number of countries had
experienced recent and quite marked declines in mortality. But because these
Recent Demographic Trends and the Family
5
mortality declines were recent, they were not yet accompanied by a decline in
fertility. As a result, the world’s population of humans soared in the middle
of the twentieth century, increasing at an extremely rapid rate. But what was
less obvious in the mid-twentieth century was that fertility decline would
also take place. So it is fertility decline that is the key to why the 7 billion
humans alive in 2012 will almost certainly not imply 14 billion humans in the
future. It is also what completes the story that Table 1 tells. That is, for most
of human history, fertility and mortality were high but mostly cancelled, so
that population growth was slow. This implies a long time for the world’s
population to double in size, which is what we see in Table 1. Then at some
point, mortality begins to decline, but fertility remains high, resulting in the
historically very rapid increases in population that we also see in Table 1. At
a last stage, mortality decline is accompanied by fertility decline, and we see
a hint of this in Table 1 in the slowing of the doubling time for the world’s
population.
THE EMERGENCE OF VERY LOW FERTILITY
As noted above, part of the story told by the first demographic is that for
nearly all of human history, births and deaths very nearly balanced one
another, and this historical balancing act led many demographers to assume
that once a nation had finished its first demographic transition, things
would again balance and, in particular, that births would settle down into
levels that would, as before, yield little or no population growth. What thus
surprised many was the emergence of very low levels of fertility, something
that first occurred in Italy, Spain, and Japan, but which now has diffused
much more widely.
“Replacement fertility” is the term demographers use to describe a level of
fertility that would imply neither population growth nor population decline
were it to be maintained for a very long time. Thus, when mortality is low,
replacement fertility would occur, for example, if each person in a generation
were to have two children over their lifetime, thus “replacing” their parents.
Demographers usually put replacement fertility a bit higher, at 2.1 children
per woman, to deal with the relatively small numbers of those who die before
reaching the typical ages of childbearing.
Thus, what was surprising about Italy, Spain, and Japan was that these
nations were the first to experience extremely low levels of fertility (Kohler,
Billari, & Ortega, 2002; McNicoll, 2012). How consequential is subreplacement fertility? Any answer to this question has to be speculative, in that it is
within the realm of possibility that countries currently experiencing extreme
levels of subreplacement fertility may experience a future reversal. But we
can nevertheless give fairly precise answers under the speculative “what if”
6
EMERGING TRENDS IN THE SOCIAL AND BEHAVIORAL SCIENCES
Table 2
Years until a Nation’s Population will Decline by a Factor of 2 over
the Long Run were there to be a Constant Level of Subreplacement
Fertility
Number of births
per woman
Years until population halving
2.0
1.9
1.8
1.7
1.6
1.5
1.4
1.3
1.2
1.1
1.0
901
279
161
112
84
66
54
45
38
33
29
Source: Author’s calculations using an expression of Kohler et al. (2002).
scenario of “what if a nation’s fertility remained at a particular subreplacement level for a long time.” Table 2 gives these numbers, presenting them
in much the same way as in Table 1, but whereas Table 1 asked how long it
took for population to double in size, Table 2 asks how long it would take for
population to halve in size—that is, decrease by a factor of two—under the
“what if” scenario in which fertility remains at a particular subreplacement
level for a very long time.
What Table 2 shows is that if fertility in a population were to remain just a
bit below replacement, population decline will be very gradual, but that at
lower levels of subreplacement levels of fertility, population decline becomes
extremely rapid. Thus, were a hypothetical nation to have an average of 1.9
children per woman rather than the replacement level of 2.1 and were this to
continue for a long time, this hypothetical nation’s population would indeed
decline, but quite slowly, taking roughly 280 years to halve in size. However,
were a hypothetical nation to have an average of 1.5 children per woman
and were this to continue for a long time, this hypothetical nation’s population would take only 66 years to halve in size—an extremely rapid pace of
population decline.
These issues are potentially worrisome in that a large and growing number of nations are currently at subreplacement levels of fertility. Countries
whose total fertility rate (TFR) is 1.5 or less in 2010 include the European
nations of Austria, Germany, Greece, Italy, Portugal, Spain, and Switzerland;
Russia and the former Soviet-bloc nations of Belarus, Bosnia and Herzegovina, Bulgaria, Croatia, Czech Republic, Hungary, Latvia, Lithuania, Serbia,
Poland, Romania, Slovenia, and Ukraine; and the Asian countries of Japan,
Hong Kong, Macao, Singapore, South Korea, and Thailand. China’s TFR is
estimated to be 1.63 in 2010.
As noted above, one caution is that the potential consequences of low fertility as given by the scenarios in Table 2 rest on the assumption that current
levels of fertility seen in 2010 will continue indefinitely into the future. Yet
another important set of cautions, somewhat technical in nature, concerns
Recent Demographic Trends and the Family
7
how to interpret fertility trends based on TFRs. An alternative way to gauge
fertility trends would be to take a group of women born in the same year
and follow them over their reproductive years, from which we could determine the average numbers of children born to this cohort of women. The
difficulty with using such a cohort measure to gauge fertility trends is that
it takes a long time—for those born in 1990, we could not determine their
completed fertility until around 2040. Because of this, demographers instead
typically compute TFRs, which are a “period” measure of fertility. In this
approach, TFRs for 2010 are constructed using the number of births in 2010 to
women aged 15–19, 20–24, etc., adjusting for the number of women in these
age groups. An advantage of the TFR is that it can be readily obtained in
any given calendar year; however, when the fertility behaviors are changing
rapidly for successive birth cohorts of women, fertility trends based on TFR’s
can be misleading. I return to this issue below.
Figure 1 looks specifically at two countries, the United States and Japan,
with the United States having fertility that has been close to replacement
levels for several decades and with Japan having had fertility well below
replacement for several decades. The upper-left-hand panel of Figure 1
shows that fertility in the United States peaked during the baby boom at 3.7
per woman in the mid-1950s, dipped slightly below replacement during the
1970s and 1980s, and then increased to just below replacement levels. Japan
had a much briefer baby boom, with fertility declining from 3.0 children per
women in 1950 to by replacement levels through the 1960s; subreplacement
levels began in 1970.
Thus, Figure 1 shows that Japan has had subreplacement levels of fertility
for about 40 years whereas the United States experienced roughly replacement levels during this same period. The consequences can be seen in the
lower panels of Figure 1, which give “age pyramids” showing the 2010 age
composition for the United States and Japan. The US baby boom is visible
as a slight bulge in the age distribution around ages 50 and 60, and there is
a similar bulge around the teens and 1920s reflecting children of the baby
boomers. Nevertheless, there are roughly the same numbers of people in the
US population who were aged 55 or younger in 2010, with (for example) the
numbers of females between age 59 or younger ranging from a high of 10.58
million aged 20–24 to a low of 9.89 million aged 10–14. At later ages, mortality begins to thin the ranks at older ages, thus producing a classic “pyramid”
shape at older ages.
The age pyramid for Japan is quite different, particularly at younger ages.
The Japanese baby boom shows up as a very sharp peak at ages 60–64, with
the children of the Japanese baby boomers showing up as another sharp peak
at ages 35–39, reflecting the more highly compressed range of ages at which
baby-boom parents in Japan had their children. But the nearly four decades of
8
EMERGING TRENDS IN THE SOCIAL AND BEHAVIORAL SCIENCES
4.0
4.0
United states
3.5
Total fertility rate
Total fertility rate
3.5
Japan
3.0
2.5
2.0
3.0
2.5
2.0
1.5
1.5
1.0
1950 1960 1970 1980 1990 2000 2010
1.0
1950 1960 1970 1980 1990 2000 2010
Year
Year
Females
Males
Females
Males
100
90
80
70
60
50
40
30
20
10
0
12
9
6
3
0
100
90
80
70
60
50
40
30
20
10
0
0
3
6
9
12
6
4
2
0
0
2
4
6
Figure 1 Change in fertility between 1950 and 2010 (upper panels) and the 2010
population age structure (lower panels) for the United States and Japan.
subreplacement fertility can be easily seen in the sharply declining numbers
at younger ages in Japan’s 2010 age distribution.
Increases in life expectancy in the US and Japan mean, for example, that
baby boomers in both countries will live longer than those born earlier in the
twentieth century. As a result, what the future holds for both countries is a
rapidly aging population, but Figure 1 also makes clear that population aging
in Japan will be far more rapid than in the United States as the consequence
of Japan’s roughly four decades of subreplacement fertility. This is why a
panel of experts concluded in a report published by the National Academy
of Sciences that the pace of population aging in the United States will depend
crucially on whether US fertility remains at roughly replacement levels or, as
has been the case in Japan and so many other countries, begins to decline to
much lower levels (National Research Council, 2012).
Why has fertility fallen to subreplacement levels in so many nations and,
conversely, why is it at roughly replacement levels in the United States? The
Recent Demographic Trends and the Family
9
answers to these questions are hotly debated by social scientists, so there is no
scientific consensus that would provide definitive answers to these questions
(Bulatao & Casterline, 2001; Hirschman, 1994; Kohler et al., 2002; McDonald,
2000; McNicoll, 2012; Morgan, 2003; Pritchett & Viarengo, 2012). Nevertheless, I have found that a hypothetical thought experiment provides some
useful insights into the emergence of subreplacement levels of fertility (Wu,
2010; see also McDonald, 2000).
So in this thought experiment, consider a hypothetical birth cohort of
women that we follow over their reproductive years and suppose further
that some women in this cohort have no children, others one, two, or three
children, but that no woman has more than three births. If so, then the average number of children per woman will be simply a weighted average—the
fraction having zero children times zero, the fraction having one child
times one, and so forth. But it also turns out to be very difficult to get to
replacement fertility under this hypothetical fertility regime. The reason is
that if even fairly modest proportions in this cohort remain childless or have
only one child, then very large proportions having three births are needed
to achieve replacement fertility.
Table 3 gives selected results from this thought experiment, with the different panels assuming different proportions of those who are childless or
who have only one birth. For example, the first panel assumes that 15% of
women are childless and that another 15% have only one birth; then because
percentages must sum to 100%, the remaining 70% must have either two or
three births. Thus, the different rows in this first panel, which consider what
happens when there are different percentages who have two or three births,
show that the 2.1 replacement level of fertility cannot be obtained unless a
small percentage (15%) have two children and a very large percentage (55%)
have three births. The second panel supposes that 20% of women are childless, slightly more than in the previous example, and that 15% have only one
child, as before. Under this hypothetical fertility regime, the 2.1 replacement
level of fertility is not reached unless until the vast majority (65%) of women
have three births and none have two births.
The remaining panels, which consider progressively larger numbers who
are childless or who have only one birth, yield a similar pattern of results.
In the third panel, in which 20% have no births and another 20% have only
one birth, it is now impossible to get to replacement levels of fertility even
when all of the remaining 60% of women have three births. The two remaining panels consider situations in which 30% remain childless; under these
hypothetical fertility regimes, it is likewise impossible to achieve replacement
levels.
There are four main takeaways to be drawn from this admittedly hypothetical thought exercise. The first is that this hypothetical fertility regime,
10
EMERGING TRENDS IN THE SOCIAL AND BEHAVIORAL SCIENCES
Table 3
Mean Number of Lifetime Births for Hypothetical Cohorts of Women
Who do not Proceed Past a Third Birth by Selected Proportions
with 0–3 Births
Number of Lifetime Births
0
0.15
0.15
0.15
0.15
0.15
0.15
0.20
0.20
0.20
0.20
0.20
0.20
0.20
0.20
0.20
0.20
0.20
0.20
0.20
0.20
0.30
0.30
0.30
0.30
0.30
0.30
0.30
0.30
0.30
0.30
0.30
1
2
3
Completed Fertility
0.15
0.15
0.15
0.15
0.15
0.15
0.15
0.15
0.15
0.15
0.15
0.15
0.15
0.20
0.20
0.20
0.20
0.20
0.20
0.20
0.20
0.20
0.20
0.20
0.20
0.20
0.30
0.30
0.30
0.30
0.30
0.60
0.50
0.40
0.30
0.20
0.15
0.60
0.50
0.40
0.30
0.20
0.10
0.00
0.60
0.50
0.40
0.30
0.20
0.10
0.00
0.50
0.40
0.30
0.20
0.10
0.00
0.40
0.30
0.20
0.10
0.00
0.10
0.20
0.30
0.40
0.50
0.55
0.05
0.15
0.25
0.35
0.45
0.55
0.65
0.00
0.10
0.20
0.30
0.40
0.50
0.60
0.00
0.10
0.20
0.30
0.40
0.50
0.00
0.10
0.20
0.30
0.40
1.65
1.75
1.85
1.95
2.05
2.10
1.50
1.60
1.70
1.80
1.90
2.00
2.10
1.40
1.50
1.60
1.70
1.80
1.90
2.00
1.20
1.30
1.40
1.50
1.60
1.70
1.10
1.20
1.30
1.40
1.50
in which no woman has more than three births, is actually reasonably
realistic—results from numerous social surveys show that most desire two
children and very few say that their ideal family size consists of four or
more children (see, e.g., Morgan, 2003). The second, which is the converse of
the first, is that achieving fertility levels approximating replacement levels
of 2.1 births per woman will very likely require that some women give birth
Recent Demographic Trends and the Family
11
to four or more children. The third concerns the crucially important role
played by women who are childless or who have only one birth. When these
proportions are in the range of 15% or 20%, it can be easy to obtain levels of
subreplacement fertility in the range of 1.6 to 1.8. The fourth and perhaps
most important takeaway is that Table 3 suggests that it is not difficult to
achieve extremely low fertility levels in the range of, say, 1.4 to 1.5 when the
percent who are childless or who have only birth are around 20% or 30%.
How realistic are the hypothetical scenarios in Table 3? Biddlecom and
Martin (2006) document that childlessness among US women aged 40–44
was 10% in 1976, 18% in 1995, and 19% in 2003. They also find a positive
correlation between childless and education, with childlessness rising with
education. But in Germany, whose TFR was 1.36 in 2010, childlessness has
been substantially higher, with more than a third of German women born in
1965 expected to remain childless (Dobritz & Gartner, 1999, cited in Kohler
et al., 2002).
SPECULATIONS ON US EXCEPTIONALISM
Why might the United States be an exception to what is occurring in so
many other highly industrialized nations? It is important to acknowledge
that there are other industrialized nations that have relatively high fertility.
On the basis of estimates for the calendar year 2010, these include the
Netherlands (1.75), Belgium (1.82), Finland (1.83), Denmark (1.86), United
Kingdom (1.88), Sweden (1.89), Norway (1.92), and France (1.97). But only
three countries have fertility that exceeded the US level of 2.06—Iceland
(2.13), New Zealand (2.14), and Israel (2.91). Israel’s high fertility may be a
reaction to the high fertility by Palestinians, with the latter standing at 4.42.
Clearly, the United States is not alone in having levels of fertility well above
the low levels of, say, 1.5, observed in so many other highly industrialized
countries, but it is clearly among a very few in which fertility is essentially
at replacement levels.
These considerations are why social scientists see the US fertility as “high”
relative to most other highly industrialized nations. There is, however, no corresponding consensus for what accounts for US exceptionalism, so that what
follows are my speculations about factors that might account for why the
United States is so different. And in what follows, I will use the phrase “relatively high” to refer to the fact that US fertility is essentially at replacement
levels and thus higher than in nearly all other highly industrialized countries.
•
Poverty. Social scientists have long observed that those in disadvantaged
segments of society tend to have more children than those in more
advantaged segments of society, with this pattern seen not just in the
12
EMERGING TRENDS IN THE SOCIAL AND BEHAVIORAL SCIENCES
•
•
•
United States but in other countries as well. Thus one plausible reason
for why US fertility is relatively high is that the US has more who are
poor.
Affluence. Yet another likely contributor to US exceptionalism is the
higher fertility in advantaged groups, at least when compared to their
advantaged counterparts in other countries. For example, women aged
40–44 with college degree or more had an average of 1.77 children, a
level higher than current fertility in the Netherlands. (I obtained these
and other estimates reported in this section using data on women aged
40–44 from the 2006—2010 National Survey of Family Growth).
Immigration. Social scientists have long observed that immigrants have
more children and this is true for US immigrants as well. Thus, women
aged 40–44 who were foreign-born had an average of 2.75 births whereas
those born in the United States averaged 2.02 births, a difference of .73
births.
Nonmarital Fertility. Childbearing outside of formal marriage has
increased substantially in the United States (Wu, 2008), with over 40%
of US births now occurring outside of formal marriage (Hamilton,
Martin, & Ventura, 2013). Women aged 40–44 who had a premarital first
birth averaged 0.47 more births than those who had a marital first birth.
DISCUSSION
In most highly industrialized countries, fertility is below replacement and
sometimes substantially so. The list of such countries is long: in 2010, nations
with fertility averaging 1.5 or fewer births per woman included: Germany
(1.36), Portugal (1.36), Italy (1.39), Greece (1.46), Switzerland (1.47), Spain
(1.51), Hungary (1.33), Poland (1.33), Ukraine (1.39), the Czech Republic
(1.43), Russia (1.44), Hong Kong (1.03), Taiwan (1.11), South Korea (1.23),
Singapore (1.26), Japan (1.34), and Cuba (1.5). Fertility levels in Canada (1.63)
and China (1.63) are only a bit higher. There is growing concern among social
scientists about the potentially quite harmful societal impacts were fertility
to remain at such very low levels. And perhaps not surprisingly, policy makers in many of these countries have begun implementing policies intended
to raise fertility. Whether such policies have or can be successful remains an
open question that continues to be hotly debated in the research community.
One notable exception has been the United States, where fertility has been at
or near replacement levels for over four decades. Because of this, the United
States possesses what I think might be most accurately characterized as a
type of “demographic potential”—the prospect that the numbers in future
Recent Demographic Trends and the Family
13
generations will be roughly the same as in current generations. This “demographic potential” will by no means solve all problems; indeed, increasing life expectancy across the developed and developing world will imply
rapidly aging populations in the US and elsewhere. But population aging
will be far more rapid in countries in which fertility is substantially below
replacement, something we have seen in vivid detail when comparing the
situations of the United States and Japan.
My argument is thus that US fertility constitutes the “demographic” part
of this “demographic potential,” and I likewise am deliberately using the
word “potential” to emphasize that potential benefits are in no way automatic. Among the likely factors behind higher US fertility is the higher fertility of disadvantaged groups in the United States. Thus, fertility is higher,
for example, among recent immigrants and among those who have children
outside of formal marriage. But these factors create additional challenges. A
first is the challenge of narrowing the gap between children raised in disadvantaged versus advantaged circumstances. That is, a society will more
fully realize its demographic potential when children more fully realize their
potential in adulthood. A second challenge is political, in that immigration
and out-of-wedlock childbearing are highly charged topics politically. These
and other issues thus pose real challenges to realizing the potential of the
demographic advantages that the United States possesses.
Still, the larger issue is that we care about children because they carry the
future of any society. The United States is in the enviable position of looking
to a future in which there will very likely be sufficient numbers in both current and future generations of children. Perhaps one small step to addressing
these and other challenges is for more of us to more fully recognize the many
ways in which societies benefit when there are sufficient numbers populating
future generations.
REFERENCES
Biddlecom, A., & Martin, S. P. (2006). Childless in America. Contexts, 5, 54.
Bulatao, R. A., & Casterline, J. B. (2001). Global fertility transition. New York, NY: Population Council.
Coale, A. J., & Watkins, S. C. (1986). The decline of fertility in Europe. Princeton, NJ:
Princeton University Press.
Ehrlich, P. (1968). The population time bomb. New York, NY: Ballantine Books.
Hamilton, B. E., Martin, J. A., & Ventura, S. J. (2013). Births: Preliminary data for
2012. National vital statistics reports 62. Hyattsville, MD: National Center for Health
Statistics.
Hirschman, C. (1994). Why fertility changes. Annual Review of Sociology, 20, 203–233.
Kohler, H.-P., Billari, F. C., & Ortega, J. A. (2002). The emergence of lowest-low fertility in Europe during the 1990s. Population and Development Review, 28, 641–680.
14
EMERGING TRENDS IN THE SOCIAL AND BEHAVIORAL SCIENCES
Lam, D. (2012). How the world survived the population bomb: Lessons from 50 years
of exceptional demographic history. Demography, 48, 1231–1262.
Lee, R. (2003). The demographic transition: Three centuries of fundamental change.
Journal of Economic Perspectives, 17, 167–190.
Malthus, T. R. (1798). An Essay on the Principle of Population. London, England: J. Johnson.
McDonald, P. (2000). Gender equity, social institutions and the future of fertility. Journal of Population Research, 17, 1–15.
McNicoll, G. (2012). Reflections on post-transition demography. Population and Development Review, 38, 3–19.
Morgan, S. P. (2003). Is low fertility a twenty-first-century demographic crisis?
Demography, 40, 589–603.
National Research Council (2012). Aging and the macroeconomy: Long-term implications
of an older population. Washington, DC: The National Academies Press.
Notestein, F. W. (1953). Economic problems of population change. Proceedings of the
Eighth International Conference of Agricultural Economists, 13–31.
Pritchett, L., & Viarengo, M. (2012). Why demographic suicide? The puzzles of European fertility. Population and Development Review, 38, 55–71.
Wu, L. L. (2008). Cohort estimates of nonmarital. Demography, 45, 193–207.
Wu, L. L. (2010). U.S. fertility in 2050: Some speculative remarks. Keynote address,
Institute of European and American Studies, Academia Sinica, Taipei.
LAWRENCE L. WU SHORT BIOGRAPHY
Lawrence L. Wu is Professor of Sociology and Director of the Population
Center at New York University. He is a recognized authority on nonmarital
fertility, family demography, and event history methods, with his research
in these area having received funding from National Institutes of Health,
the National Science Foundation, the William T. Grant Foundation, and the
Assistant Secretary for Program Evaluation. He has been a Fellow at Center
for Advanced Study in the Behavioral Sciences (1991–1992); Faculty Scholar
of the William T. Grant Foundation (1992–1998); and Distinguished Alumni
Scholar, Stanford University (2010). He was previously a faculty member at
the University of Wisconsin-Madison and Princeton University, and has held
visiting positions at Columbia and Yale. He has chaired the American Sociological Associations (ASA) Sections on Population (2006–2007) and Quantitative Methodology (2003–2005); the Technical Review Committee (2002–2006),
an advisory panel to the National Longitudinal Surveys; and the ASA Committee on the Status of Gays, Lesbians, Bisexuals in Sociology (1996). He has
served as a member of the Board of Directors of the Population Association of
America (2002–2005), the ASA Committee on Nominations (1999–2000), the
Council of the ASA Section on Quantitative Methodology (1997–1999), the
Board of Overseers of the Panel Study of Income Dynamics (1996–2002); and
Recent Demographic Trends and the Family
15
was co-organizer (with P. Gottschalk and R. Moffitt) of the Annual Summer
Research Workshop on Problems of the Low-Income Population, Institute for
Research on Poverty, University of Wisconsin-Madison (1998–2005). He currently serves as series editor (with M. Alvarez, N. Beck, and S. Morgan) of
Analytical Methods for Social Research (Cambridge, 2003-present) and as book
review editor of Sociological Methods and Research (2000-present).
RELATED ESSAYS
The Sexual Division of Labor (Anthropology), Rebecca Bliege Bird and Brian
F. Codding
Parenting with Digital Devices (Psychology), Pamela E. Davis-Kean and
Sandra Tang
Intergenerational Mobility (Economics), Steve N. Durlauf and Irina
Shaorshadze
Sexual Behavior (Anthropology), Melissa Emery Thompson
Patterns of Attachment across the Lifespan (Psychology), Robyn Fivush and
Theodore E. A. Waters
Family Relationships and Development (Psychology), Joan E. Grusec
Divorce (Sociology), Juho Härkönen
Grandmothers and the Evolution of Human Sociality (Anthropology), Kristen
Hawkes and James Coxworth
Family Formation in Times of Labor Market Insecurities (Sociology), Johannes
Huinink
Cultural Neuroscience: Connecting Culture, Brain, and Genes (Psychology),
Shinobu Kitayama and Sarah Huff
Maternal and Paternal Employment across the Life Course (Sociology),
Michaela Kreyenfeld
Intergenerational Mobility: A Cross-National Comparison (Economics),
Bhashkar Mazumder
The Future of Marriage (Sociology), Elizabeth Aura McClintock
Below-Replacement Fertility (Sociology), S. Philip Morgan
Limits to Human Longevity (Sociology), Samuel H. Preston and Hiram
Beltrán-Sánchez
Demography and Cultural Evolution (Anthropology), Stephen Shennan
Family Income Composition (Economics), Kristin E. Smith
Social Neuroendocrine Approaches to Relationships (Anthropology), Sari M.
van Anders and Peter B. Gray
Transnational Work Careers (Sociology), Roland Verwiebe